


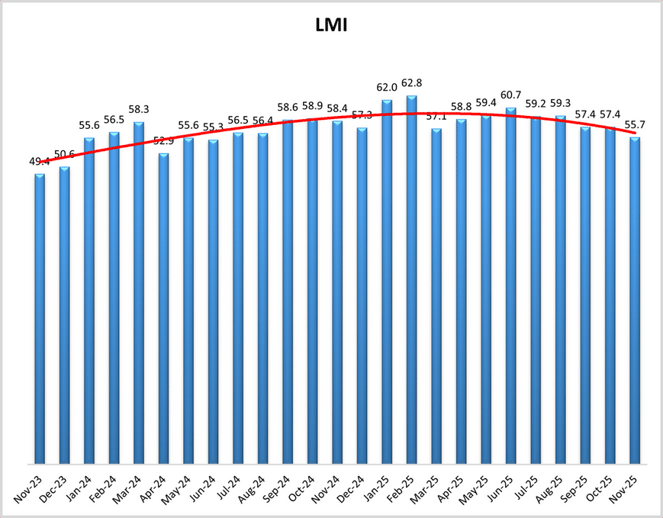
While the overall Logistics Managers' Index (LMI) fell back slightly, transportation kept up its end of the bargain in November. The LMI itself came in at 55.7, down 1.7 from the prior month. The reading is the lowest since June of 2024 and marks nine straight months below the index's all-time average of 61.4. But there is some good news...
The transportation metrics are telling a positive story for that corner of the industry. Transportation Prices rose again, with a 3.2 point increase to 64.9 - it's highest figure in 10 months. Conversely, Transportation Capacity fell 4.5 to 50 - its lowest reading since September 2024. That nearly 15 point gap trails only January of 2025 as the largest since April 2022. And such a lead for prices over capacity tends to signal a healthy market.
The question for this particular signal is whether it's seasonal - as in, will the strength showed in November's holiday retail period carry over post-Christmas? The answer is, that there's at least some likely tie-in. As for Transportation Utilization, it actually fell back 5.8 from October, to 51.5.
So if transportation looked good, why did the index fall? Blame a severe drop in Warehousing Utilization, which fell 9.5 into contraction at 47.5. Contraction is unfamiliar territory for that metric, as it's never been there before in the LMI's history. Authors point to a major drawdown in inventory built up throughout the year heading into the holidays. The drop in utilization showed up a bit in a 2.8 point increase in Warehousing Capacity, which landed at 54.8.
But the Inventory Levels metric actually gained three points to 52.5, back into expansion after having fallen into contraction the month prior. Inventory Costs are still expanding, but a bit more mildly (-2.4) at 70.8. In fact, November's was the second lowest reading of the year for that index component.
So with a mixed backdrop, what did respondents think the LMI (and thus the market) would look like in 12 months? They predicted the index would read at 62.9, down 1.7 from October's prediction but still above its long-term average. Key drivers of the prediction are Inventory Levels expanding slowly at 56.7, but Transportation Prices outpacing all metrics at 78.4, carrying a more than 30 point advantage over Transportation Capacity.
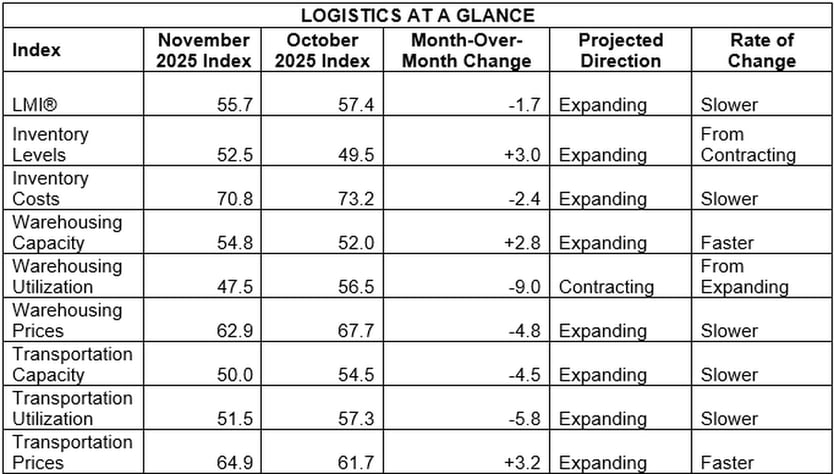
By the Numbers
See the summary of the November 2025 Logistics Managers' Index, by the numbers:
About the Logistics Managers' Index (LMI)
Researchers at Arizona State University, Colorado State University, Rochester Institute of Technology, Rutgers University, and the University of Nevada, Reno - in conjunction with the Council of Supply Chain Management Professionals (CSCMP) - issue the report. The LMI score is a combination of eight unique components that make up the logistics industry, including: inventory levels and costs, warehousing capacity, utilization, and prices, and transportation capacity, utilization, and prices.
The LMI is calculated using a diffusion index, in which any reading above 50.0 indicates that logistics is expanding; a reading below 50.0 is indicative of a shrinking logistics industry. The latest results of the LMI summarize the responses of supply chain professionals collected in November 2025. Learn more about the index on our podcast with its primary author Zac Rogers, Ph.D., associate professor of Supply Chain Management at Colorado State University.
Need assistance with your shipping operations? Request a quote with us, and we'll get back to you to discuss your unique needs. Go to our Freight Guides to learn more about everything freight and logistics. Additionally, visit our blog for information and updates on the freight industry.