
This Week at a Glance
Week ending May 25, 2026
Intermodal Spot Rate
(excluding fuel)
▲ +0.1% vs. last week
▼ -4% vs. last year
Truckload Spot Rate
(excluding fuel, DAT)
▼ -4% vs. last week
▲ +4.5% vs. last year
Diesel Fuel
(EIA National Average)
▼ -1.3% vs. last week
▲ +58.4% vs. last year
Intermodal Volume
(YTD vs. 2025)
U.S. ▲ +1.2%
North American ▲ +1.1%
This Week's Analysis
By Rick LaGore, CEO, InTek Logistics | May 25, 2026
Analysis of the InTek Intermodal Index (III) and freight market trends
Trends in the Intermodal Transportation Spot Rate and Market
Eight consecutive weeks of intermodal spot rate improvement. Diesel declining for a third straight week. And U.S. intermodal volumes posting their strongest year-over-year reading of the current recovery.
Those are the constructive data points this week. The complicating one is truckload, which fell 4.0% week over week after two weeks of modest softness. A TL pullback of that size while intermodal holds flat raises familiar questions about what is driving rate behavior on each side. The framework still applies.
And those questions are worth asking. Eight straight weeks of gains sounds more dramatic than the data actually shows. Intermodal spot rates ex-fuel are still below where they started the year at $1.12 per mile, down roughly 2.7% from that opening level. This is not a rocket ship recovery. It is a slow, grinding climb off a cycle low that still has ground to make up before it crosses into genuinely constructive territory. Progress? Yes. Cause for celebration? Not yet.
InTek Intermodal Index (excluding fuel):
- Up 0.1% vs. prior week
- Down 4% vs. prior year
The train keeps rolling. The InTek Intermodal Index, which tracks domestic intermodal spot rates, has now seen eight weeks in a row of gains. Two of those weeks (the past two in fact) have come in at +0.1%, which is as close to flat as the data produces without going negative. The streak is intact, but the pace has slowed noticeably.
The year-over-year comparison improved marginally from -4.2% to -4.0%. And while the eight-week run has narrowed the year-over-year deficit by 4.4 percentage points from the late-March low, it is worth keeping that in context. Intermodal spot rates ex-fuel are still sitting below where they opened the year.
The recovery is real, but it's also modest, uneven, and not yet at a level that changes the fundamental cost picture for most shippers. While holding ground as truckload pulls back is constructive, it doesn't signal a market that has turned decisively higher.
National Truckload Spot Rate (DAT, excluding fuel): (DAT Trendline Report)
- Down 4% vs. prior week
- Up 4.5% vs. prior year
Truckload fell again this week. A 4% week-over-week decline is one of the sharper single-week drops in recent months and follows a 1.7% pullback the prior week. Two consecutive weeks of meaningful TL softness while intermodal holds relatively flat is a configuration worth reading carefully.
The supply-driven rally thesis remains the most coherent explanation. Capacity has been leaving the market under sustained fuel cost pressure and FMCSA enforcement activity. That tightening does not produce smooth, linear rate increases. Instead, it produces a volatile pattern where rates spike on capacity stress and pull back when that stress temporarily eases.
Essentially, a 4% weekly decline in truckload means the immediate pressure that pushed rates higher has paused. What it doesn't mean is that capacity is growing.
The year-over-year comparison still sits at +4.5% for the third straight week, which continues to reflect base effects as much as current market strength. Watch whether that year-over-year number begins to erode if the weekly weakness continues into June.
Diesel Fuel (EIA):
- $5.523/gallon
- Down $0.073 (1.3%) vs. prior week
- Up $2.036 (58.4%) vs. prior year
Diesel declined for a third consecutive week. That is now a trend, and it is the most sustained easing this report has tracked since the Middle East escalation began driving crude markets higher in early March.
From the near-peak of $5.643 on April 6, diesel has pulled back $0.12 over three weeks to $5.523. The pace of decline has been modest, $0.001, $0.043, and $0.073 respectively, but the direction has held consistently. Three straight weeks of lower diesel is a different animal than the two-week pause that appeared briefly in late March before reversing sharply.
The 2022 record of $5.810 now sits $0.287 away. Two weeks ago that gap was $0.171. The record is still within reach on a bad week in the Middle East, but the immediate pressure that made it feel imminent has receded meaningfully.
For carriers, three weeks of modest decline begins to provide at least marginal relief on margin structures that have been compressed since early March. While they're not enough to reverse capacity decisions already made (or to bring capacity back into the market), they are enough to slow the pace of exits for operators who were holding on waiting for any directional change in fuel costs.
For shippers, three weeks of easing doesn't change the planning message. Build cost models around elevated diesel through the end of the year. The geopolitical situation that drove this spike has not resolved, and a single escalation in global energy markets can reverse three weeks of decline in one EIA reading. In other words, the direction is better, but the risk hasn't gone away.
(The full spreadsheet of the historical weekly price moves of diesel full can be found at https://www.eia.gov/petroleum/gasdiesel.)
Year-to-Date Intermodal Volume by Region and Railroad vs. 2025
The volume data this week is the strongest this report has produced in the current recovery. U.S. intermodal is now running +1.2% year over year. North American intermodal is at +1.1%. Both are the highest readings since the YTD deficit began closing in late March.
The context from prior weeks still matters here. These positive year-over-year readings are being measured against a 2025 baseline that included meaningful tariff-driven pull-forward activity concentrated in the first half of the year. Running positive against that inflated baseline, and improving that positive reading week over week, is a stronger underlying signal than the headline percentage alone suggests.
GMXT stabilized and moved higher, from +13.3% last week to +14.8% this week. The sharp drop from the 20%+ readings of prior weeks appears to have been a one-week normalization rather than the beginning of a sustained decline in cross-border Mexico freight activity. Two consecutive weeks in the 13-15% range suggests a new, still-elevated baseline for cross-border volumes rather than a return toward the broader network averages.
The rest of the network held largely steady and continued its gradual improvement. BNSF extended to +3.6%. CSX moved to +4.7%, its best reading of the cycle. NS improved to +2.0%. UP reached -5.8%, now more than 13 percentage points recovered from the -18.7% cycle low and closing in on the threshold where the gap becomes a rounding issue rather than a structural story. CPKC improved modestly to -2.1%. CN slipped slightly to -0.5%, holding in marginally negative territory for the third consecutive week.
The two railroads still in negative territory, UP and CPKC, continue reflecting specific corridor dynamics that the broader recovery has not fully reached. Both are improving, but neither is improving at the pace of the eastern network or cross-border corridors.
North American Intermodal
1.1%
U.S. Intermodal
1.2%
Volume by Class 1 Railroad
| BNSF | 3.6% |
| CN | -0.5% |
| CPKC | -2.1% |
| CSX | 4.7% |
| GMXT | 14.8% |
| NS | 2% |
| UP | -5.8% |
Intermodal Spot Rate Trend Charts
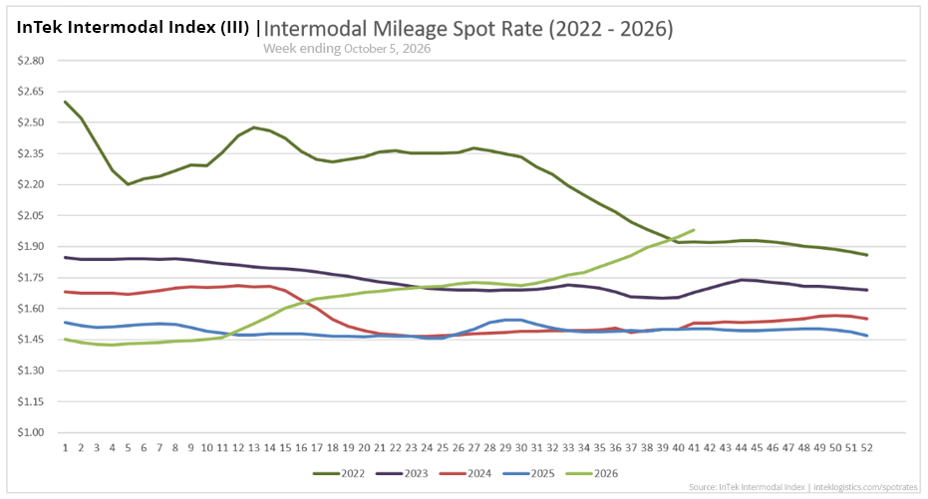
Intermodal Spot Rate Per Mile (Including Fuel)
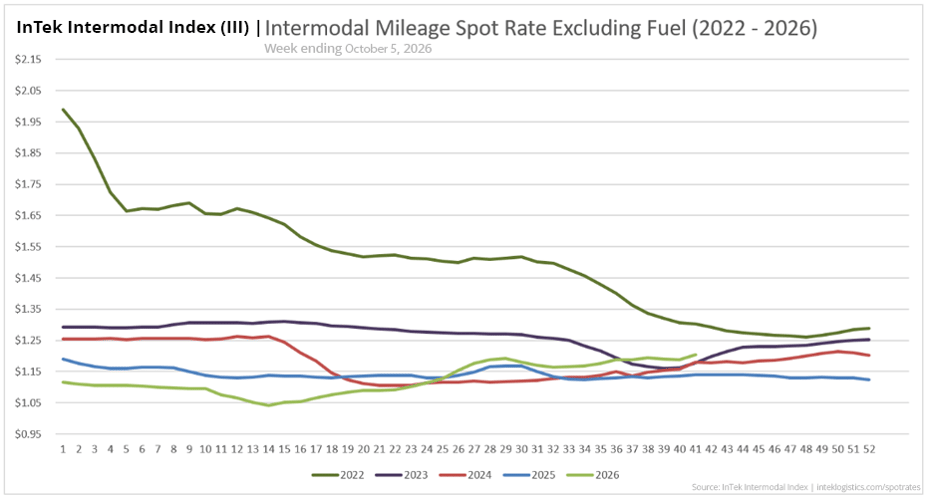
Intermodal Spot Rate Per Mile (Excluding Fuel)
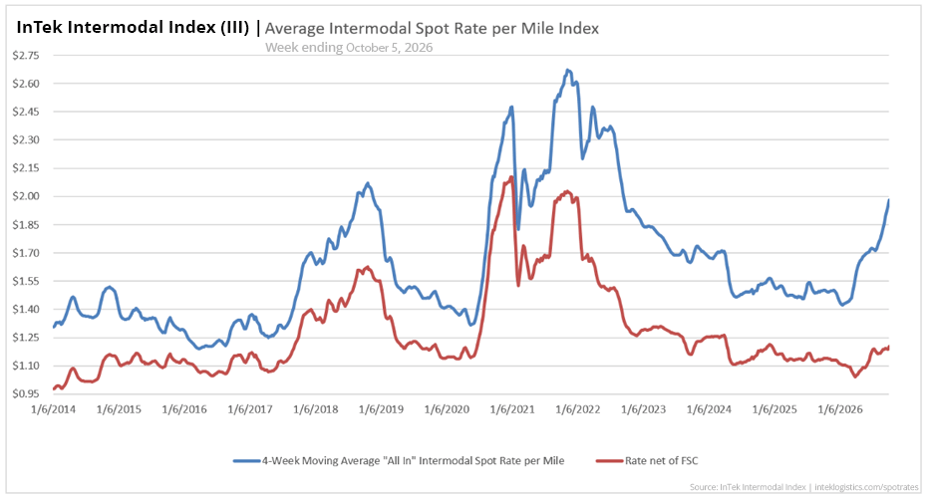
Intermodal Spot Rate Average Per Mile (2014-2026)
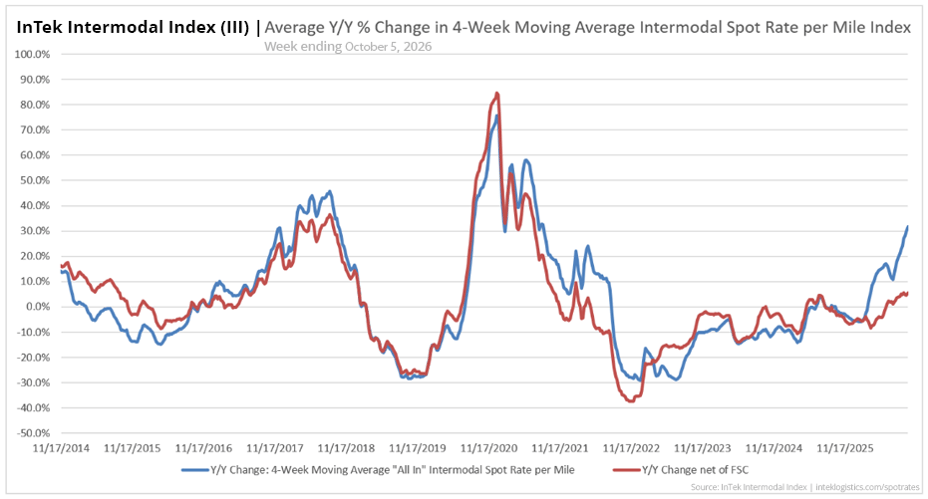
Intermodal Spot Rate Y/Y % Change (2014-2026)

What to watch next week
Three things to watch heading into the week of June 1, 2026.
Does intermodal break out of the +0.1% consolidation pattern?
Two consecutive weeks of near-flat gains kept the streak alive but raised questions about momentum. A return to the 0.6-1.2% weekly improvement range that characterized weeks three through six of this run would signal that the consolidation is over and the recovery is resuming. A third consecutive +0.1% week, or a decline, would suggest the rate recovery has stalled at current levels.
Does truckload stabilize after two consecutive weeks of pullback?
Truckload has now declined 1.7% and 4.0% in back-to-back weeks. The supply-driven rally thesis absorbs that kind of volatility without invalidating the trend. But a third consecutive week of TL weakness alongside flat intermodal would begin to raise questions about whether the capacity tightening story has more staying power than the rate data currently reflects.
Does the volume improvement hold as May comparisons get harder?
The 2025 pull-forward activity was concentrated in the spring months, meaning the year-over-year comparisons heading into June are among the most challenging of the year. Holding or improving on the current +1.1% to +1.2% North American and U.S. readings against that tougher baseline would be the most meaningful volume confirmation this report has seen yet.
Last week's scorecard
Last week we flagged three things. Here is how they played out.
-
Intermodal extended the streak to eight consecutive weeks, barely, at +0.1% for the second straight week. The trend held. The momentum question remains open.
-
Diesel held its decline through a third consecutive week. Down $0.073 to $5.523. Three straight weeks of easing is the most sustained diesel relief since the March escalation began.
-
GMXT stabilized and improved modestly to +14.8% after last week's drop from +21.8% to +13.3%. The moderation from extraordinary levels appears to have found a new elevated baseline rather than continuing lower.
About the InTek Intermodal Index:
The InTek Intermodal Index (III) tracks weekly domestic intermodal spot rates on a per-mile basis, both including and excluding fuel surcharges. Each week's report includes comprehensive market analysis covering truckload pricing trends, diesel fuel costs, and Class I railroad intermodal volumes to provide context for rate movements.
Published every Thursday since 2014, the Index serves as a resource for shippers, carriers, and industry analysts tracking North American freight market trends.
Citation: InTek Intermodal Index. (2026). Weekly Intermodal Spot Rate Report. Retrieved from https://www.inteklogistics.com/spot-rates
Want custom pricing for your lanes?
Get a tailored intermodal quote based on your specific shipping needs and freight profile.