
<img alt="" src="https://secure.perk0mean.com/182585.png" style="display:none;">

red-accent


InTek Intermodal Index (III) Weekly Market Analysis

InTek Intermodal Index (III) Logo


Weekly market intelligence including the InTek Intermodal Index (tracking intermodal spot rates), along with truckload pricing, diesel trends, and railroad volumes

Updated every Thursday | Last updated: October 22, 2026 | View historical archive

Get an intermodal quote

About-Hero-curve-1

This Week at a Glance

Week ending October 19, 2026

Train Truck Background Sketch-Light-Even

This Week's Analysis

By Rick LaGore, CEO, InTek Logistics | October 20, 2026

Analysis of the InTek Intermodal Index (III) and freight market trends

Trends in the Intermodal Transportation Spot Rate and Market

Intermodal spot is up again this week with truckload also gaining ground. The ex-fuel intermodal index gained 0.9% and sits 7.6% above last year. Truckload spot added 1.6% and holds 46.8% above 2025.

The fuel line's brief three-week streak of declines is over, as diesel is up almost 10 cents to $6.276. That places it 73.4% or $2.66 per gallon above last year. US intermodal volume runs 4.4% ahead of 2025 year to date while North American sits +3.5% - both ticking up from last week.

The quarter's open question continues to surround volume. Will truckload conversion hold the line as imports slow? So far the answer is yes, but as the quarter continues, we'll know more.

While intermodal continues going up, truckload is generally keeping pace - so that plus once again rising fuel keeps the cost case for intermodal a strong one for shippers considering converting.

InTek Intermodal Index (excluding fuel):

  • Up 0.9% vs. prior week
  • Up 7.6% vs. prior year

The InTek Intermodal Index (III), which tracks intermodal spot rates, rose 0.9% for the week and is now 7.6% above last year. It's another week of a record spread compared to 2025 - the third week in a row in fact.

We continue to look at weekly pricing for the clearest market signal, and it's staying on an upward trajectory. As noted last week, outbound California is tight on boxes and dray, which adds to the strength on West Coast lanes. Dray is where shippers continue to see service strain in many markets, even as rail service stays steady.

National Truckload Spot Rate (DAT, excluding fuel): (DAT Trendline Report)

  • Up 1.6% vs. prior week
  • Up 46.8% vs. prior year

Truckload spot added 1.6% for the week and holds 46.8% above last year - a magic annual number that's shown up quite often in the weekly reports. Intermodal spot has narrowed the annual gap a bit in the past month or two, but truckload prices (plus diesel) do not appear headed down anytime soon.

Gas Pump Sketch Light

Diesel Fuel (EIA):

  • $6.276/gallon
  • Up $0.097 (1.6%) vs. prior week
  • Up $2.656 (73.4%) vs. prior year

Diesel's small two cent dip in last week's report was a harbinger of things to come, as it marked the narrowest of a three week pullback. This week, it's headed back up, nearly 10 cents and 1.6% from the week prior, to $6.28 per gallon. That puts diesel up 73.4%, or $2.66 per gallon versus this time last year - and it puts more distance from the current price and a magic number of $5 that could start making a dent in the truck-to-rail gap.

Most analysts put any meaningful relief in 2027. Rail is roughly three times more fuel efficient than over-the-road truck on a ton-mile basis. At a 73.4% year-over-year gap, fuel keeps pulling marginal long-haul freight to rail.

The driver has not changed. This run sits in refining and distillate supply, not in crude, and any retreat will track the same place. 

(The full spreadsheet of the historical weekly price moves of diesel full can be found at https://www.eia.gov/petroleum/gasdiesel.)


Year-to-Date Intermodal Volume by Region and Railroad vs. 2025

North American intermodal volume runs 3.5% ahead of 2025 year to date and US volume 4.4%. The cumulative figures sit below the recent pace. A calendar shift around Labor Day pulls on the comparison, and the underlying growth rate reads firmer in the mid-single digits once that noise is set aside.

The growth is uneven by geography. Mexico cross-border is the standout, with GMXT at 10.9% year to date and running well higher on a recent basis as nearsourcing routes more freight through that corridor. The Western US network holds the domestic growth, BNSF at 5.2% ahead of UP at 2.7%, though UP has climbed back to firmly positive. The Eastern carriers have slipped to the mid-single digits, CSX at 5.3% and NS at 4.2%. Both now trail the North American pace, the first sustained Eastern lag since spring. CPKC improved to 1.8% while CN at -2.7% remains the one carrier below last year.

One current underneath the figures is worth holding onto. Recent volume has carried an import boost alongside the conversion and cross-border story, and that import run is set to recede through the fourth quarter after an early-autumn peak. Whether domestic conversion holds the volume as the imports fall away is the quarter's real test.

North American Intermodal

3.5%

U.S. Intermodal

4.4%

Volume by Railroad

BNSF 5.2%
CN -2.7%
CPKC 1.8%
CSX 5.3%
GMXT 10.9%
NS 4.2%
UP 2.7%


Dark-blue-curve-up

Intermodal Spot Rate Trend Charts

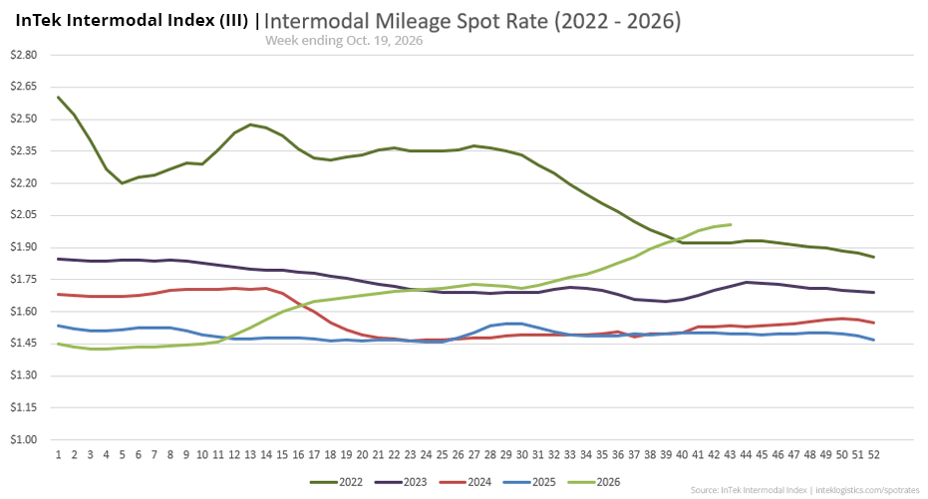
InTek Intermodal Index (III) spot rate per mile including fuel, showing weekly trends

Intermodal Spot Rate Per Mile (Including Fuel)
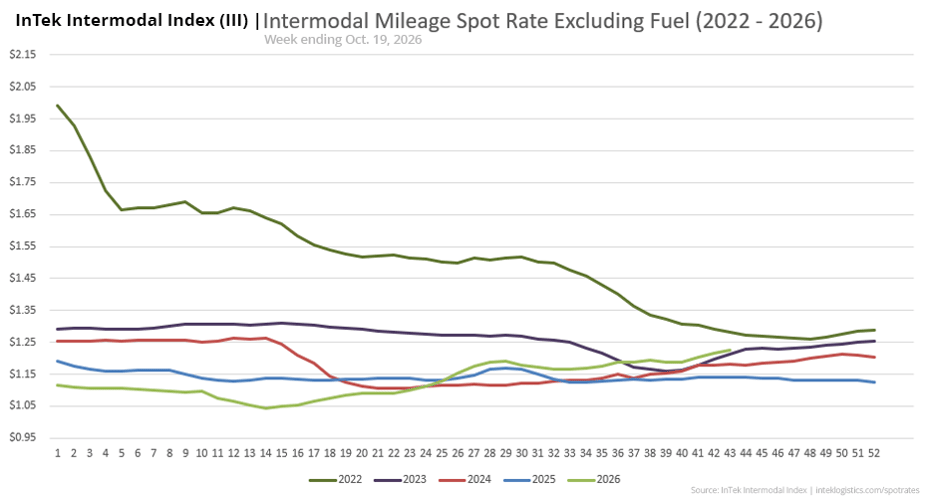
  

InTek Intermodal Index (III) spot rate per mile excluding fuel, showing weekly trends

Intermodal Spot Rate Per Mile (Excluding Fuel)
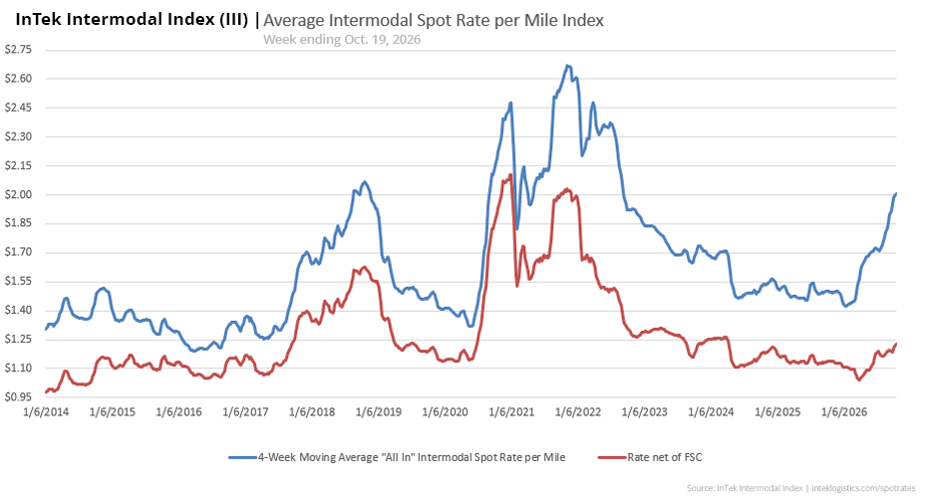
 

InTek Intermodal Index (III) average intermodal spot rate per mile from 2021 to 2026 Intermodal Spot Rate Average Per Mile (2014-2026)
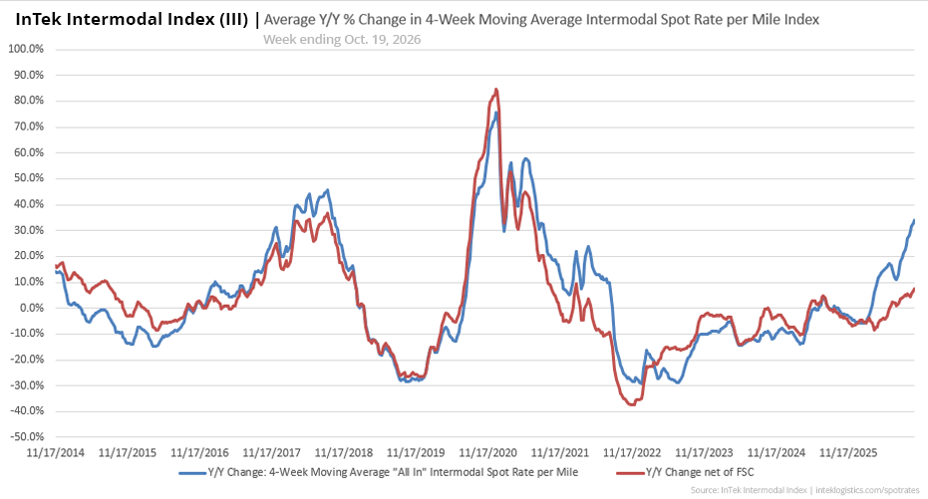
InTek Intermodal Index (III) average intermodal percentage rate change per mile from 2021 to 2026

Intermodal Spot Rate Y/Y % Change (2014-2026)

medium-blue-curve-down-right

What to watch next week

Three things to watch heading into the week of October 26, 2026.

Last week's scorecard

Last week we flagged three things. Here is how they played out.

  • Does intermodal spot extend or stall? No stalling yet. The weekly gain was slightly slimmer (0.9%), but it's still gaining nonetheless.

  • Has diesel found a floor near $6? It doesn't look that way. After a brief three weeks of some relief, diesel was back up 10 cents last week to $6.28 a gallon - moving further away from $6, let alone $5.

  • Does the import roll-off begin, and does conversion hold? Volumes ticked up weekly for both North American and U.S. intermodal, so no big dips as of yet.

About the InTek Intermodal Index:

The InTek Intermodal Index (III) tracks weekly domestic intermodal spot rates on a per-mile basis, both including and excluding fuel surcharges. Each week's report includes comprehensive market analysis covering truckload pricing trends, diesel fuel costs, and railroad intermodal volumes to provide context for rate movements.

With rates tracked weekly since 2008, the Index serves as a resource for shippers, carriers, and industry analysts tracking North American freight market trends.

Citation: InTek Intermodal Index. (2026). Weekly Intermodal Spot Rate Report. Retrieved from https://www.inteklogistics.com/spot-rates

Divider


Want custom pricing for your lanes?

Get a tailored intermodal quote based on your specific shipping needs and freight profile.