


United States intermodal volume accelerated in July even as the broader freight market stayed soft, and that divergence is the key freight signal for the month.
Intermodal volume rose 7.2 percent year over year in the week ending July 18, while the June Cass Freight Index put shipments 4.1 percent below last year. J.B. Hunt reported 16 percent growth in its Eastern intermodal network against 5 percent in Transcon, and Union Pacific reported domestic intermodal volume up approximately 19 percent while international intermodal declined 14 percent.
No single reading proves highway-to-rail conversion, but together they represent the strongest evidence of this cycle that a substantial portion of freight is shifting from truck to rail.
The economic incentive is equally clear. The door-to-door, ex-fuel spread between truckload and the InTek Intermodal Index (III) - measuring spot rates - widened from roughly $0.48 per mile a year ago to $1.19 today. Truckload has repriced sharply. Intermodal pricing has begun to move, but it has not kept pace. That combination creates a conversion window that is unusually attractive and unlikely to stay this wide.
Key Takeaways:
- Why intermodal volume accelerated while the broader freight market stayed soft, and what that combination does and does not establish
- How the truckload-to-intermodal spread widened to its widest point of this cycle, and why the timing matters more than the size
- What five major transportation companies reported in an eight-day stretch, and which of their numbers are the cleanest reads
- Why diesel reversed course in two weeks, and why crude alone no longer explains the fuel line
- What the economic indicators say about near-term freight demand once you filter them through a freight lens
- Where this analysis could be wrong, and why the combined evidence still points the same direction
July 2026 Freight Market Trends
Intermodal Market Overview
| Indicator | Reading | Year-over-Year |
|---|---|---|
| InTek Intermodal Index Spot Rate (ex-fuel) | $1.18/mi | +2.6% |
| National TL Spot Rate (DAT, ex-fuel) | $2.37/mi van linehaul (June average) | +45.4% |
| Truckload-to-Intermodal Spread | $1.19/mi | Widened from $0.48/mi |
| On-Highway Diesel (EIA) | $5.134/gal | +34.7% |
| U.S. Intermodal Volume (week ending 7/18) | 297,017 units, +7.2% | YTD +3.8% |
Intermodal spot rates crossed into positive year-over-year territory and held there, which is the milestone we flagged last month. At $1.18 per mile excluding fuel, pricing sits 2.6 percent above where it stood a year ago. Both this figure and the truckload comparison below are door-to-door and exclude fuel surcharge, so the two are measured on the same basis.
The more consequential number is what happened around it. Truckload van linehaul rose to $2.37 per mile, an increase of roughly 74 cents from a year ago. Over the same period, InTek's intermodal index rose about 3 cents.
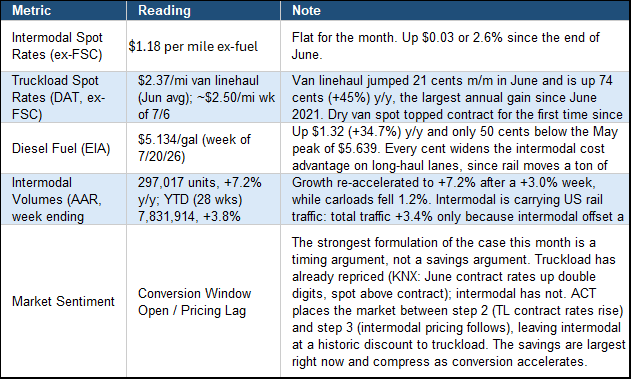
That is the story of the month in two numbers. A year ago the spread between truckload and intermodal ran 48 cents per mile. Today it runs $1.19 against the June truckload average, and $1.32 against the week of July 6. Stated differently, intermodal now prices at approximately half of truckload, against roughly seven tenths a year ago. On a 750-mile lane, that is a spread near $890 versus $360 last year, though lane-level economics move with dray density and lane balance, so the figure on any individual lane will differ.
Volume improved as well. United States intermodal ran 7.2 percent above last year in the week ending July 18, re-accelerating after a softer 3.0 percent the prior week. Intermodal accounted for all of that week's United States rail traffic growth, more than offsetting a 1.2 percent carload decline to leave total traffic up 3.4 percent.
Week-over-week detail is published every Thursday on the InTek Intermodal Index (III).
Truckload Market Overview
Truckload spot rates rose 45.4 percent year over year on a linehaul basis, the largest annual gain since June 2021. Dry van spot topped contract rates for the first time since February 2022, which historically signals the beginning of broad contract repricing across the industry. ACT Research reports contract rates running approximately 12 percent above last year.
The driver remains supply rather than demand. ACT reports spot load postings up 65 percent year over year while equipment postings fell 17 percent, which is the capacity exit expressed in a single comparison. The same research puts truckload volumes up only 1.9 percent, so the rate move is not being generated by freight demand.
Knight-Swift's second-quarter results put a company-level number on the same condition. Revenue per tractor rose 6 percent while the average tractor count declined 3 percent. Carriers are earning more per truck because there are fewer trucks. Management attributed the improvement to pricing and network efficiency, and noted that more recent bids entering the network largely reflected double-digit pricing gains.
The Logistics Managers' Index reinforces the point. Transportation capacity has now contracted for seven consecutive months at a reading of 30.8, and transportation utilization reached 74.7, an eight-year high.
Diesel and Energy Overview
Diesel reversed direction in July, abruptly so. On-highway diesel bottomed at $4.578 per gallon on July 6, then rose 21.8 cents the following week and another 33.8 cents the week after, reaching $5.134 on July 20. That is a 55.6-cent move in two weeks, retracing slightly more than half of the $1.06 decline from the May peak. Diesel now sits $1.32 above year-ago levels, up 34.7 percent, and only 50 cents below the recent peak of $5.639.
| Week | Diesel Price | Additional Comments |
|---|---|---|
| Week of 5/11/26 | $5.639/gal | Cycle peak, start of a nine-week decline |
| Week of 7/6/26 | $4.578/gal | Low point of the pullback |
| Week of 7/13/26 | $4.796/gal | First weekly increase in ten weeks |
| Week of 7/20/26 | $5.134/gal | Back above $5.00, up 55.6 cents in two weeks |
Crude contributed to the reversal, but the larger move came from refining margins. The benchmark 3-2-1 crack spread, a broad measure of refinery economics covering gasoline and distillates, reached a record $69.66 per barrel on July 16. Russia banned most diesel exports on July 8 following sustained strikes on its refining system, and United States distillate inventories remain roughly 11 percent below their five-year average even after a recent build.
For shippers, the practical conclusion is that crude alone is no longer sufficient to explain the fuel line. A transportation budget built around a crude forecast, or around any single point estimate for diesel, is using the wrong instrument for this market.
The mode implications are direct. Rail moves a ton of freight roughly three to four times farther per gallon than a truck, a national average rather than a lane-level guarantee. When diesel runs more than a dollar above the prior year, that efficiency difference stops being academic and starts showing up in landed cost. The offset deserves equal billing: rail fuel surcharges move as well, and drayage legs burn diesel at truck rates.
What the Carriers Reported
Five major transportation companies reported second-quarter results inside an eight-day window this month. Taken together, they describe the same market from different vantage points.
J.B. Hunt, released July 15. Intermodal volume rose 10 percent to a record 578,000-plus loads, the first double-digit intermodal quarter in more than a decade. Monthly cadence accelerated through the quarter at 9 percent in April, 9 percent in May, and 12 percent in June. Management described intermodal's value proposition as the strongest in more than 10 years. The Eastern network grew 16 percent against a Transcon network that grew 5 percent, and J.B. Hunt attributed the Eastern strength specifically to conversion and service execution.
Knight-Swift, released July 22. Adjusted earnings per share rose to $0.63 from $0.35 a year earlier. Revenue per tractor improved while the average tractor count declined, and management pointed to double-digit pricing gains in recent bids. This is the truckload side of the same market condition.
CSX, released July 22. Intermodal volume rose 9 percent and was the largest contributor to total volume growth of 6 percent, on record revenue of $3.94 billion. Management cited tighter truck capacity and truck-to-rail conversion, and raised full-year guidance. The 9 percent volume figure is the cleaner market indicator, because fuel surcharges materially inflated the revenue line.
Norfolk Southern, released July 23. Record quarterly revenue of $3.5 billion, up 11 percent on volume growth of 4 percent. Intermodal was the fastest-growing major segment, with revenue up 22 percent on 5 percent higher volume. Fuel surcharges accounted for six of the company's 11 percentage points of total revenue growth, so the volume figure is again the more reliable read.
Union Pacific, released July 23. Intermodal revenue rose approximately 26 percent to $1.39 billion in a record quarter. The more informative detail sits underneath that number: domestic intermodal volume increased approximately 19 percent while international intermodal declined 14 percent.
Union Pacific's mix makes a simple import-flow explanation less convincing. If the acceleration were primarily imports moving inland, international volumes would be expected to lead, and they fell. The qualification worth stating is that some domestic containers carry transloaded import freight, particularly at Southern California gateways, so the split does not establish that all domestic growth came from highway conversion. Combined with J.B. Hunt's 16 percent Eastern growth and management's specific commentary on conversion however, it materially strengthens the case.
Two cautions belong with all of this. First, revenue is not volume. Diesel is inflating rail revenue lines the same way it is inflating truckload cost, which is why the volume figures at CSX, Norfolk Southern, and Union Pacific's domestic segment are the numbers worth weighting. Second, service is already feeling the volume. CSX told analysts its dwell and trip-plan performance are not where the company wants them, because demand arrived stronger than planned against tight crew availability in some locations. Intermodal train speeds have slowed across the major railroads as volume has grown.
Economic Pulse
InTek publishes the full leading-indicator set each month as a standing reference. We do not walk through every line. The table below is the complete data with links to each source so you can go deeper where it matters to your business.
| Indicator | Latest Reading | Trend vs. Prior Month | Source |
|---|---|---|---|
| Cass Freight Index – Shipments | ~1.009 (Jun) | -4.1% y/y / -3.1% m/m | Cass |
| Cass Freight Index – Expenditures | 3.64 (Jun) | +11.2% y/y / +2.2% m/m | Cass |
| Industrial Production (US) | ~102.7 (Jun) | +1.1% y/y / +0.1% m/m | FRED |
| NAICS 3327 – Machine Shops | 95.70 (May) | +2.1% m/m | FRED |
| ISM Manufacturing PMI | 53.3 (Jun) | -0.7 pts m/m | ISM |
| ISM Services PMI | 54.0 (Jun) | -0.5 pts m/m | ISM |
| Housing Starts (SAAR) | 1,427,000 (Jun) | +19.0% m/m / +3.5% y/y | Census |
| Consumer Confidence Index | 91.2 (Jun) | +0.6 pts m/m | Conference Board |
| Inventory-to-Sales Ratio | 1.25 (May) | -0.01 m/m | FRED |
| Logistics Managers' Index (LMI) | 71.1 (Jun) | +1.6 pts m/m | LMI |
| BLS Nonfarm Payrolls | +57,000 (Jun) | Unemployment 4.2% | BLS |
| U. Michigan Consumer Sentiment | 54.4 (Jul prelim) | +10% m/m | U. Michigan |
| Diesel Fuel (EIA) | $5.134/gal (7/20/26) | +33.8¢ w/w / +34.7% y/y | EIA |
| Port of LA/LB Volumes | LA 1,002,734 / LB 779,331 TEUs (Jun) | +12.0% LA / +10.6% LB y/y | POLA / POLB |
Logistics Managers' Index, upstream and downstream detail
| Metric | Upstream | Downstream |
|---|---|---|
| Inventory Levels | 59.1 | 66.0 |
| Transportation Utilization | 74.6 | 75.0 |
| Transportation Prices | 90.4 | 97.9 |
The economic data this month resolves into a familiar freight-relevant read: the production side is holding, the demand side is not confirming, and neither is generating the kind of surge that would explain the rate move on its own.
Industrial production grew at a 4.0 percent annualized rate in the second quarter, and manufacturing output posted its fastest quarterly gain in five years at 4.7 percent annualized, supported by AI-related buildout and pre-emptive inventory accumulation. Both Institute for Supply Management (ISM) indexes remain in expansion, though both cooled slightly. The ISM Manufacturing Prices Index fell 9.1 points to 73.0, the steepest one-month decline since July 2022, which suggests input cost pressure may be peaking.
The demand side is weaker than the headlines suggest. Nonfarm payrolls added only 57,000 jobs, with April and May revised down a combined 74,000. The unemployment rate fell to 4.2 percent for the wrong reason, a shrinking labor force rather than hiring, with participation dropping to 61.5 percent. Consumer confidence rose slightly while its Present Situation component fell to its lowest level since March 2021, with 22.5 percent of consumers reporting that jobs are hard to get, a five-year high. Housing starts jumped 19 percent, but the gain came almost entirely from a 76.3 percent multifamily rebound off a weak May, and permits fell 3.0 percent, signaling the surge may not carry.
The freight-specific lines tell the clearest story. The Logistics Managers' Index printed 71.1, its first reading above 70.0 since March 2022, led by Inventory Levels rising 5.7 points to 60.5 as downstream retailers pulled goods forward. That pull-forward pushed transportation utilization to an eight-year high while transportation capacity contracted for a seventh straight month.
The inventory picture requires holding two readings together. Inventory-to-sales sits at 1.25, the lowest since January 2023, while the LMI shows inventory building accelerating sharply through June, from 55.4 early in the month to 66.3 later. Read together, the two suggest companies began rebuilding from relatively low inventory levels, driven in part by tariff-related pull-forward rather than by a broad restocking cycle.
Both SoCal ports posted their strongest June on record, with Los Angeles up 12.0 percent and Long Beach up 10.6 percent, with both citing importers moving cargo forward ahead of expected tariff changes and continued trade-policy uncertainty.
That pull-forward deserves care in second-half planning. It is real volume and it tightens capacity now, but it borrows from future demand rather than creating new demand, which means the comparisons later in the year get harder rather than easier.
What Could We Be Misreading?
A month of data that all points one direction deserves scrutiny rather than celebration. Three limitations belong on the record.
Domestic intermodal includes transloaded import freight. Containers moving in domestic equipment out of Southern California may carry imported goods transloaded from ocean boxes. Union Pacific's domestic growth of 19 percent against an international decline of 14 percent is therefore strong evidence rather than proof, because part of that domestic growth can trace back to imports rather than to freight coming off a truck.
One strong week does not establish a trend. The 7.2 percent figure for the week ending July 18 followed a 3.0 percent week. Year-to-date growth of 3.8 percent is the more durable measure, and it is roughly half the weekly headline.
Provider growth is not the same as market growth. J.B. Hunt at 10 percent and CSX at 9 percent both exceed the market as measured by the Association of American Railroads. Individual carriers gain share, add lanes, win specific customers, and grow parcel and other non-conversion traffic. Company results overstate what is happening across the market as a whole.
None of these caveats dissolve the case, though. The argument rests on the combination of J.B. Hunt's Eastern growth and explicit management commentary, Union Pacific's domestic-versus-international split, rising United States intermodal volume against a soft broader freight market, and a truckload-to-intermodal spread that has widened to more than twice its year-ago level. Any one of those readings has an alternative explanation, but all four pointing the same direction in the same month is harder to explain away.
Intermodal Outlook
The truckload-to-intermodal spread is the lever shippers should be watching, and it widened from both directions this month. Truckload repriced while diesel reversed higher, and intermodal pricing moved only modestly.
ACT Research frames the sequence usefully. Historically, truckload spot rates rise first, truckload contract rates follow, and intermodal pricing adjusts last. The market currently sits between the second and third steps. Truckload has repriced substantially. Intermodal has begun to move, up 2.6 percent, but its adjustment remains modest by comparison. That gap is why the current savings opportunity is unusually wide, and it is also why it is unlikely to stay this wide once intermodal pricing catches up.
On lane length, several sources point toward the same range while measuring it differently. J.B. Hunt reports Eastern conversion substantially outpacing Transcon. C.H. Robinson identifies the 550-to-1,500-mile band. ACT and Cleveland Research recommend evaluating conversion above roughly 700 miles. InTek has used a 750-mile threshold for years. The carrier results and 3PL observations are evidence of freight actually moving; the research recommendations corroborate the conclusion rather than independently confirming it.
The constraint worth naming is drayage. ACT and Cleveland both identify it as the most capacity-sensitive portion of the intermodal network and the likeliest source of service disruption, because dray carriers compete for the same labor pool that truckload is currently bidding up. Rail linehaul remains fluid. The first and last mile is where a rushed conversion goes wrong, which is why conversion works better planned than reactive.
The structural point underneath all of it is the one this analysis has held throughout. Capacity leaving a market is not the same as demand entering it, and the two call for different responses. A recovery you wait to confirm with volume is a recovery you join late.
What Shippers Should Be Doing Now
- Price intermodal lanes now, while the market sits between truckload repricing and intermodal repricing, rather than after that gap closes
- Audit truckload lanes between 700 and 1,500 miles first, since that is where carrier results and 3PL observations both point
- Secure drayage capacity alongside rail commitments, because the first and last mile is the operative constraint rather than the linehaul
- Rebuild landed-cost models around a diesel range rather than a point estimate, given a fuel market now driven as much by refining margins as by crude
- Separate pull-forward from underlying demand in your own volume planning, so the harder comparisons later in the year do not catch your network flat-footed
July 2026 Freight Market Summary
- Intermodal volume accelerated while the broader freight market stayed soft, a pattern consistent with highway-to-rail conversion
- Truckload linehaul rose roughly 74 cents per mile year over year while intermodal rose about 3 cents, widening the spread from 48 cents to $1.19
- Five major transportation companies reported inside eight days, with Union Pacific's domestic intermodal up 19 percent while international fell 14 percent
- Diesel reversed 55.6 cents in two weeks on refining margins as much as crude, widening intermodal's fuel-efficiency advantage again
- The window is open because truckload has repriced and intermodal has only begun to, and that sequence historically closes
Frequently Asked Questions
What is the current intermodal spot rate? As of late July 2026, the InTek intermodal Index sits at $1.18 per mile for spot rates excluding fuel, up 2.6 percent year over year.
How much cheaper is intermodal than truckload right now? The spread runs approximately $1.19 per mile on a door-to-door, ex-fuel basis, compared with 48 cents per mile a year ago. Intermodal currently prices at roughly half of truckload, against about seven tenths a year ago. Lane-level economics vary with dray density and lane balance.
Is truck freight converting to intermodal in 2026? The evidence points that way without proving it outright. United States intermodal volume rose 7.2 percent year over year in mid-July while the broader freight market stayed soft, and Union Pacific reported domestic intermodal volume up approximately 19 percent while international fell 14 percent. Some domestic containers carry transloaded imports, so the split is strong evidence rather than proof.
Why did diesel prices jump in July 2026? On-highway diesel rose 55.6 cents in two weeks to $5.134 per gallon on July 20. The move was driven more by refining margins than by crude, with the 3-2-1 crack spread reaching a record $69.66 per barrel on July 16, alongside Russia's July 8 diesel export ban and distillate inventories running roughly 11 percent below their five-year average.
What did the Q2 2026 railroad earnings say about intermodal? CSX reported intermodal volume up 9 percent and identified it as the largest contributor to volume growth, specifically citing truck-to-rail conversion. Norfolk Southern reported intermodal as its fastest-growing major segment, with revenue up 22 percent on 5 percent higher volume. Union Pacific reported domestic intermodal volume up approximately 19 percent. All three sets of results are consistent with tightening truck capacity.
Should shippers convert truckload freight to intermodal now? For lanes over roughly 700 miles, the case is stronger than at any point in this cycle. Truckload has repriced substantially while intermodal has moved only modestly, which is why the current spread is unusually wide. That sequence historically closes, so the economics available today are unlikely to persist at this width.
About the InTek Monthly Intermodal Shipping Report
The InTek Monthly Intermodal Shipping Report provides a data-driven snapshot of North American intermodal trends, integrating rail network performance, economic indicators, intermodal pricing, and strategic market intelligence for shippers.
If you'd like to evaluate how intermodal fits into your freight strategy, visit the InTek Logistics blog, where we continually add fresh how-to articles and other industry insights. If you'd like a lane-by-lane evaluation, simply request a quote to get started.
Related Reading:
-
- InTek Intermodal Index for week-over-week spot rate, diesel, and volume detail, updated every Thursday.