


Key Takeaways
- Most lanes favored intermodal, in both origin and destination markets: Intermodal cost less than truckload on 88% of lanes in May 2026 and 76% in May 2025, and nearly 72% of lanes favored it in both years.
- Longer lanes saved more often: Every lane of 2,500 miles or more averaged at least 8% savings, while only one in four lanes under 750 miles did and two-thirds of those cost more by intermodal. Distance alone did not decide the result.
- Tighter capacity widened the gap: Average savings across all lanes rose from 7.5% in spring 2025 to 21.0% in spring 2026, as truckload capacity tightened and over-the-road rates rose.
- Direction matters: The same two cities can price differently each way. Dallas to Kearny averaged about $910 per load in savings, compared with about $400 for Kearny to Dallas.
- Treat qualified lanes as a program (InTek’s recommendation): Recurring, forecasted volume gives providers a basis to plan equipment, drayage, and appointments. The study did not measure service performance.
Based on spot rates for 600+ US lanes, April and May of 2025 and 2026. Each lane is weighted equally, and the results are market rates, not customer savings.

Shippers continually balance price, available capacity, and service in their logistics strategies. With cost perhaps the greatest driver of movement between truckload and intermodal, this study examines intermodal and truckload spot rates on more than 600 U.S. lanes across two different capacity environments. The goal is to help shippers identify where savings persist, see how market conditions changed the opportunity, and decide which lanes merit a closer pricing and service review.
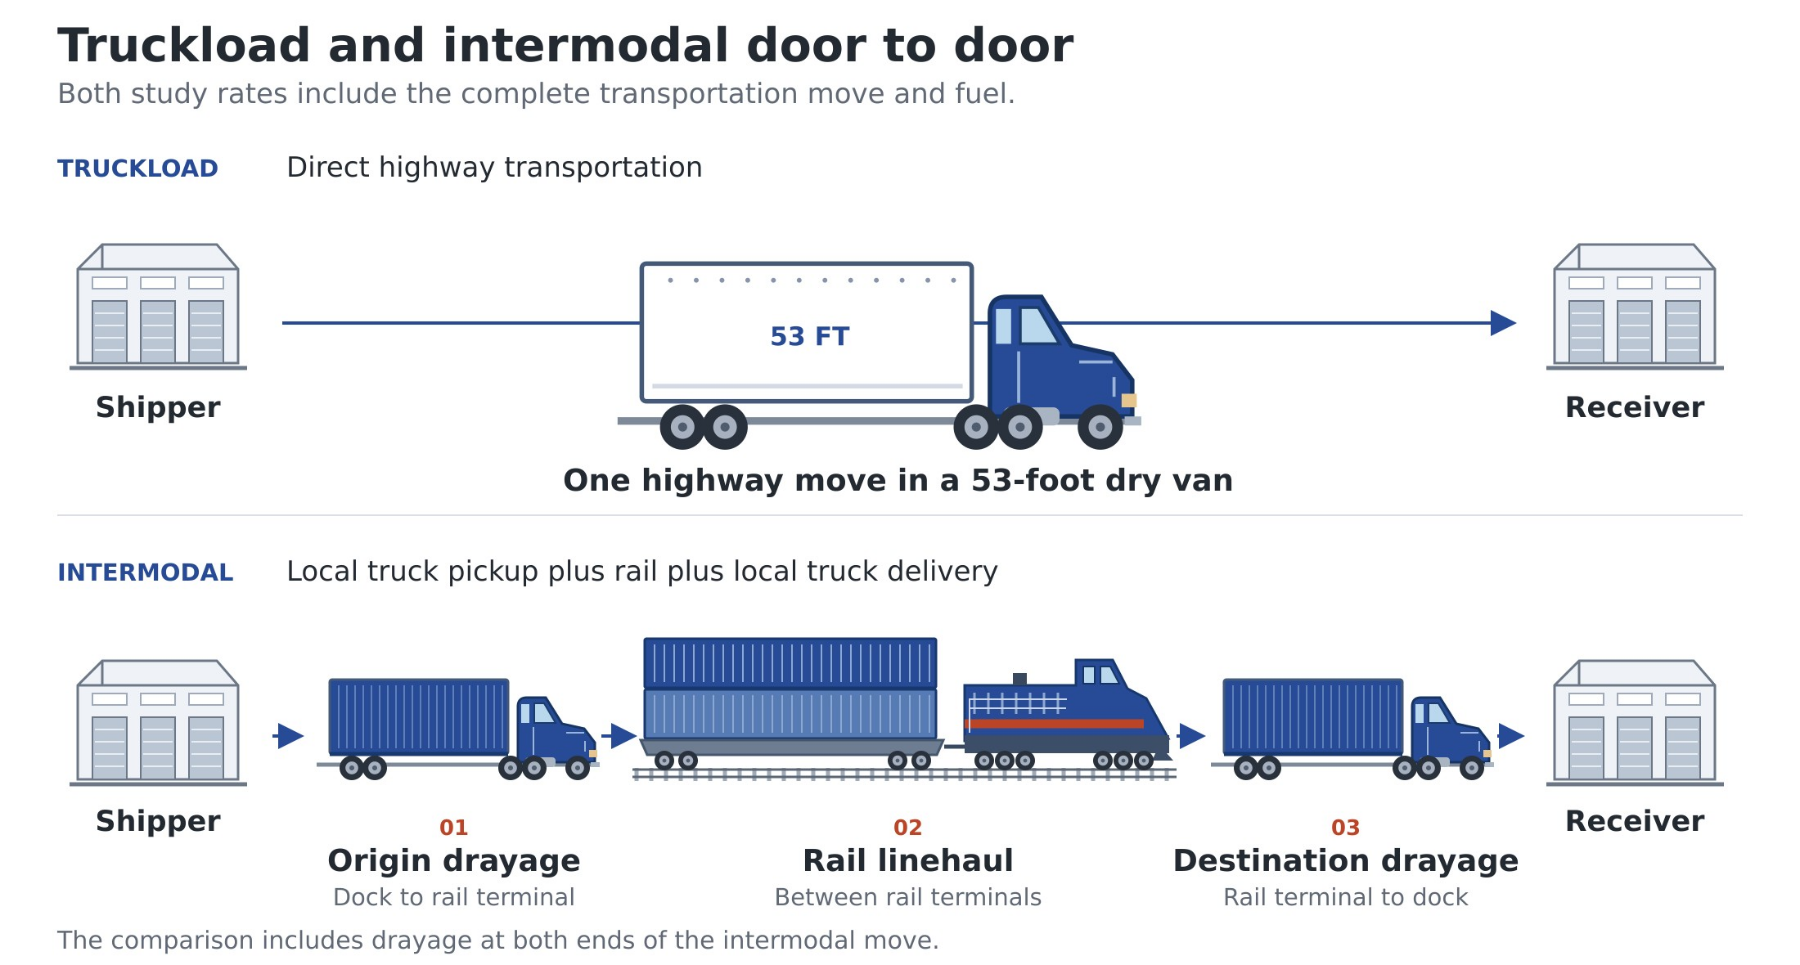
With all that being said about pricing as a decision-driver, a low rate has limited value if the equipment is unavailable or the shipment misses its delivery requirements. As freight markets change, the challenge is to maintain that balance across the network.
For many shippers, truckload provides most of their 53-foot capacity. Intermodal adds another option by combining local trucking with rail for the longer portion of the journey. On suitable lanes, that combination can reduce transportation cost and give shippers access to capacity beyond the highway network.
Interest in intermodal often increases when truckload rates rise and trucks become harder to secure. Yet the case for using it can extend beyond a tight market. The question is which lanes retain a worthwhile savings advantage when truckload capacity becomes plentiful again, and how to make those lanes work reliably over time.
At InTek, we encourage shippers to evaluate intermodal as a continuing part of their transportation strategy. Recurring volume and shipment forecasts give providers a basis for planning containers, drayage, and delivery appointments. Keeping a qualified lane in a program allows that operating knowledge to develop; repeatedly starting and stopping requires parts of the process to be rebuilt. [5, 6]
The best way to compare truckload and intermodal lanes is to run the test across multiple - in this case two - sets of market conditions.
Why the study uses spot rates
Spot freight rates react quickly to changes in shipping demand and available capacity. Contract rates usually adjust more slowly through bid cycles. Spot trends can therefore provide early signals of pricing pressure and help shippers assess transportation alternatives before renewing contracts. [1] Here, they provide a common basis for comparing the two modes. A recurring program still requires pricing for the shipper’s own volume and operating needs.
Why it compares the same spring months
We selected April and May of both 2025 and 2026 to compare the same point in the annual freight calendar. This places both periods after the typical early-year lull and ahead of the fall holiday peak, while aligning recurring spring influences on freight demand and capacity.
The months are not free of seasonal pressure. Produce shipments, Roadcheck inspections, and Memorial Day can affect rates. Matching the months reduces the effect of comparing different seasons; it does not eliminate seasonal or year-specific disruptions. [2]
Two different capacity environments
Spring 2025 offered relatively plentiful truckload capacity and softer pricing. By spring 2026, capacity had tightened and truckload rates had strengthened. [3, 4] The comparison helps distinguish savings that persisted in both markets from opportunities that emerged as conditions changed.
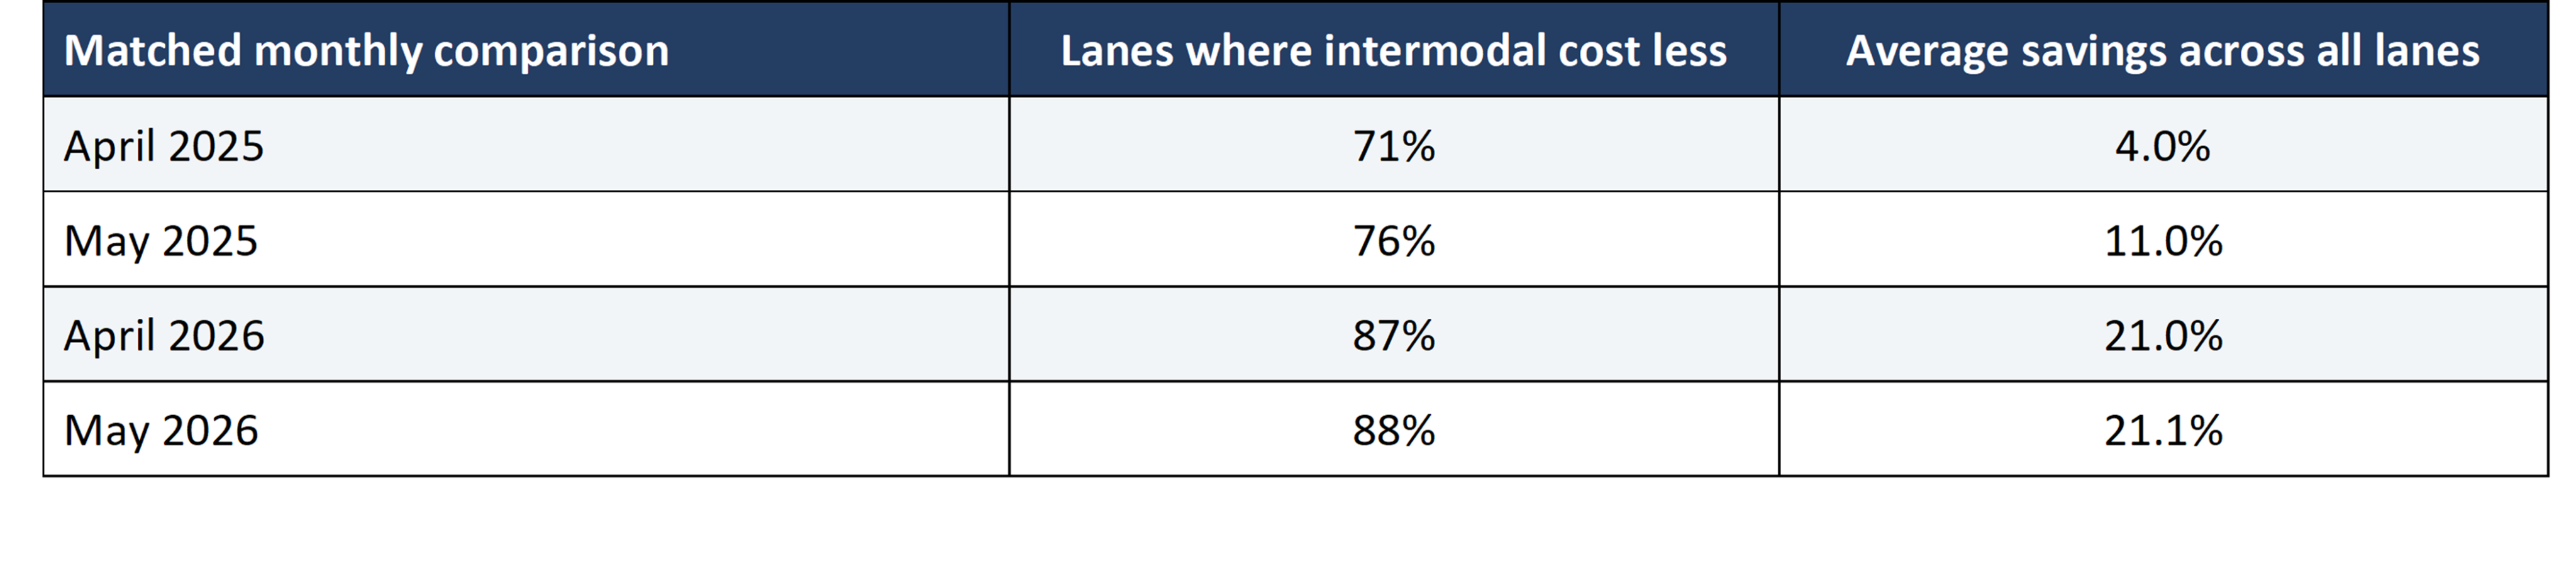 Nearly 72% of lanes favored intermodal in both years, based on each year’s two-month average. Within that group, average savings increased from 21.6% in 2025 to 30.4% in 2026. Across all lanes, savings averaged 7.5% and 21.0%, respectively, and improved on 83% of lanes. Intermodal cost less in every monthly observation on 66% of lanes.
The findings support reviewing intermodal beyond periods of truckload shortage. Many lanes retained savings in the looser market, while tighter conditions generally increased the advantage and made additional lanes economical. They do not establish that savings are permanent or that every lane belongs on intermodal.
Note: Both modes include door-to-door transportation and fuel. Intermodal includes local trucking, or drayage, at each end. Each lane receives equal weight; the percentages describe this study, rather than a shipper’s volume-weighted budget.
As a rule, the strongest savings come unsurprisingly on lanes with the greatest haul, as those maximize rail's cost advantage. Across all lanes, 74% averaged savings of at least 8%, 64% averaged at least 15%, and 51% averaged at least 20%. These thresholds overlap. Intermodal cost more than truckload on 18% of lanes; the remaining lanes saved less than 8%.
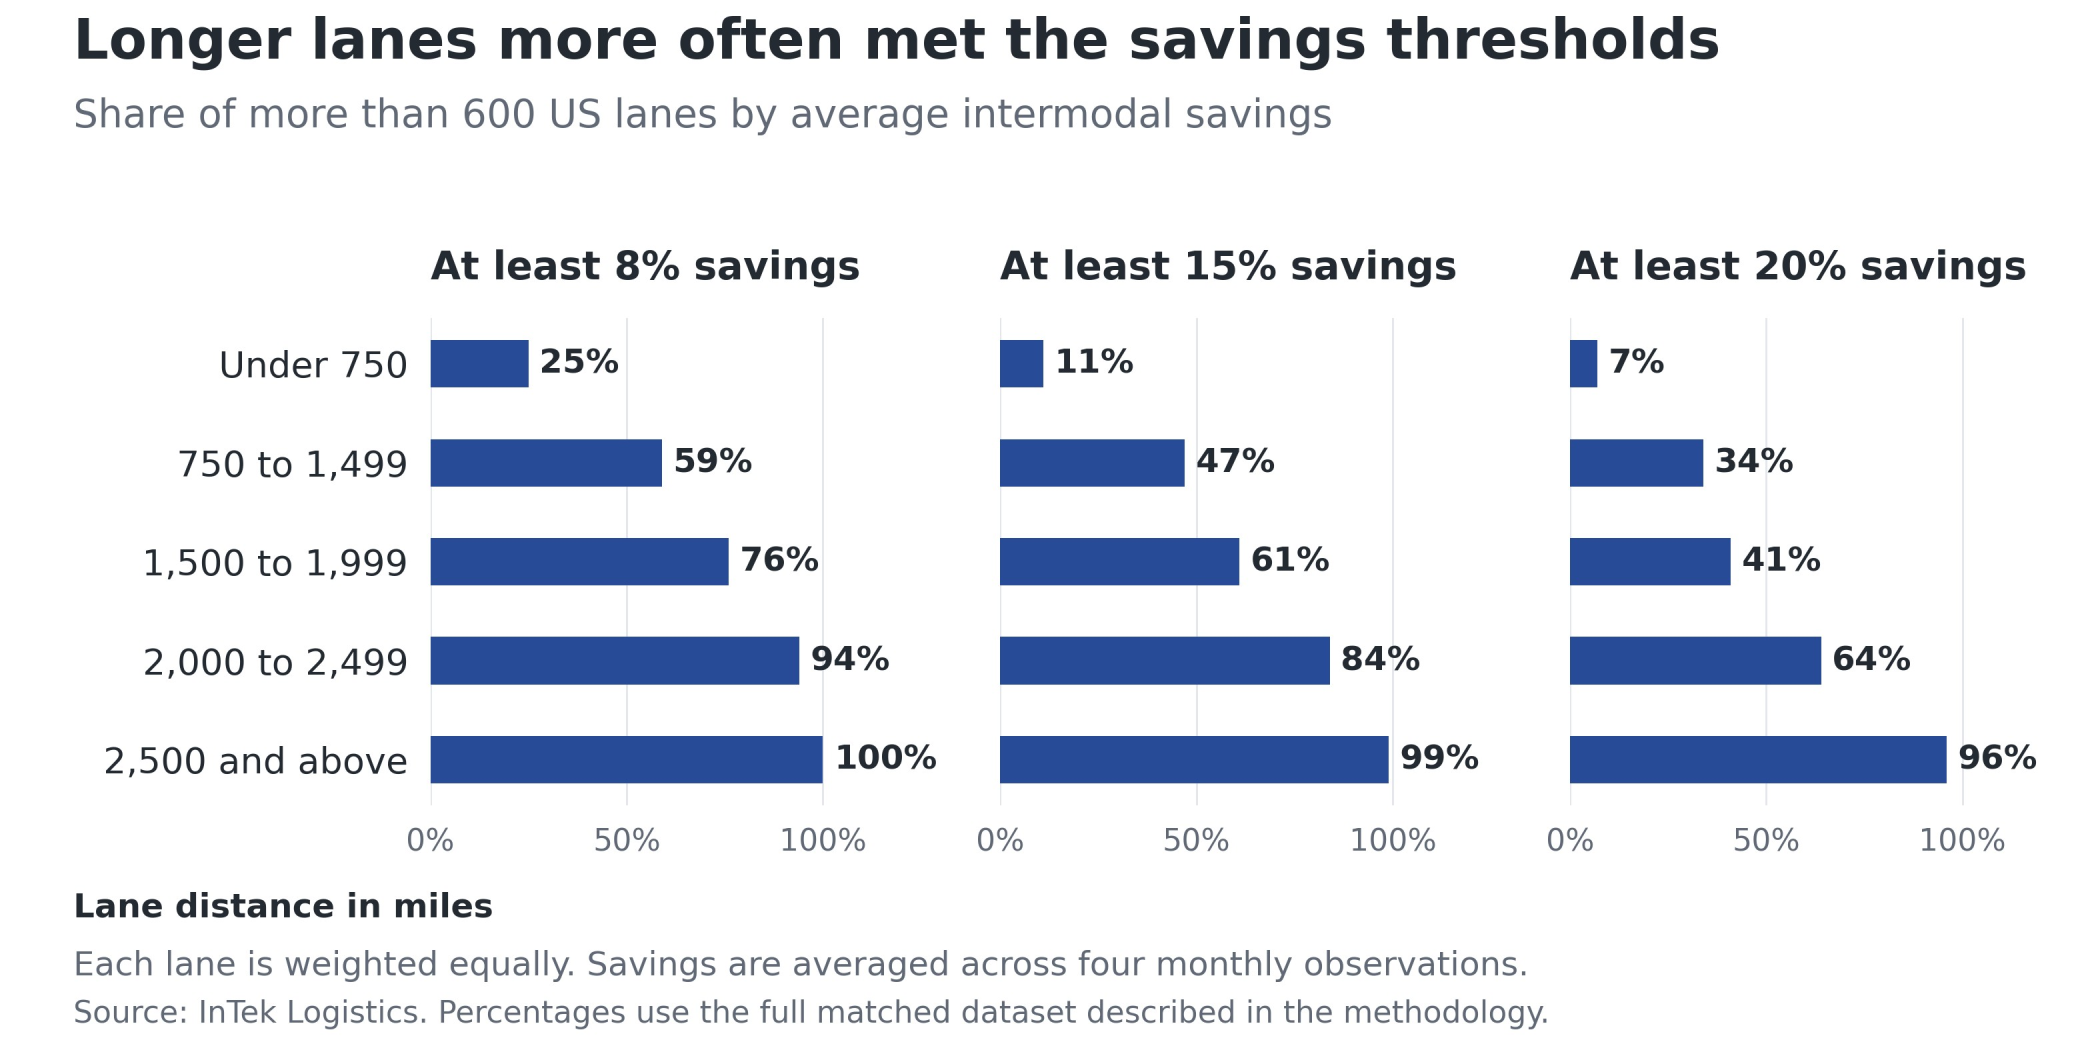
Among lanes of 2,000 miles or more, 97% averaged at least 8% savings. Average savings were about $1,110 per load from 2,000 to 2,499 miles and $1,930 at 2,500 miles or more. Below 750 miles, only one in four lanes averaged at least 8% savings. Longer rail moves have more miles over which to offset drayage costs, but distance alone does not determine the result.
Prioritize lanes for a recurring program
Longer lanes are a productive starting point because the rate advantage appeared more frequently. Between 750 and 1,999 miles, roughly two in three lanes averaged at least 8% savings, but results varied by corridor. Select lanes with both a credible cost advantage and freight patterns that allow equipment and service to be planned.
The 8%, 15%, and 20% thresholds help rank opportunities. They do not determine the right mode by themselves. The decision should consider expected total cost, capacity needs, and delivery performance over a sustained period, including how the lane would perform if the price gap narrowed.
To evaluate what individual lanes look like, let's consider four examples. These historical examples show how distance and direction affect the opportunity. Rates and dollar differences are averages across the observations. They are starting points for a review, rather than current quotes or achieved customer savings.
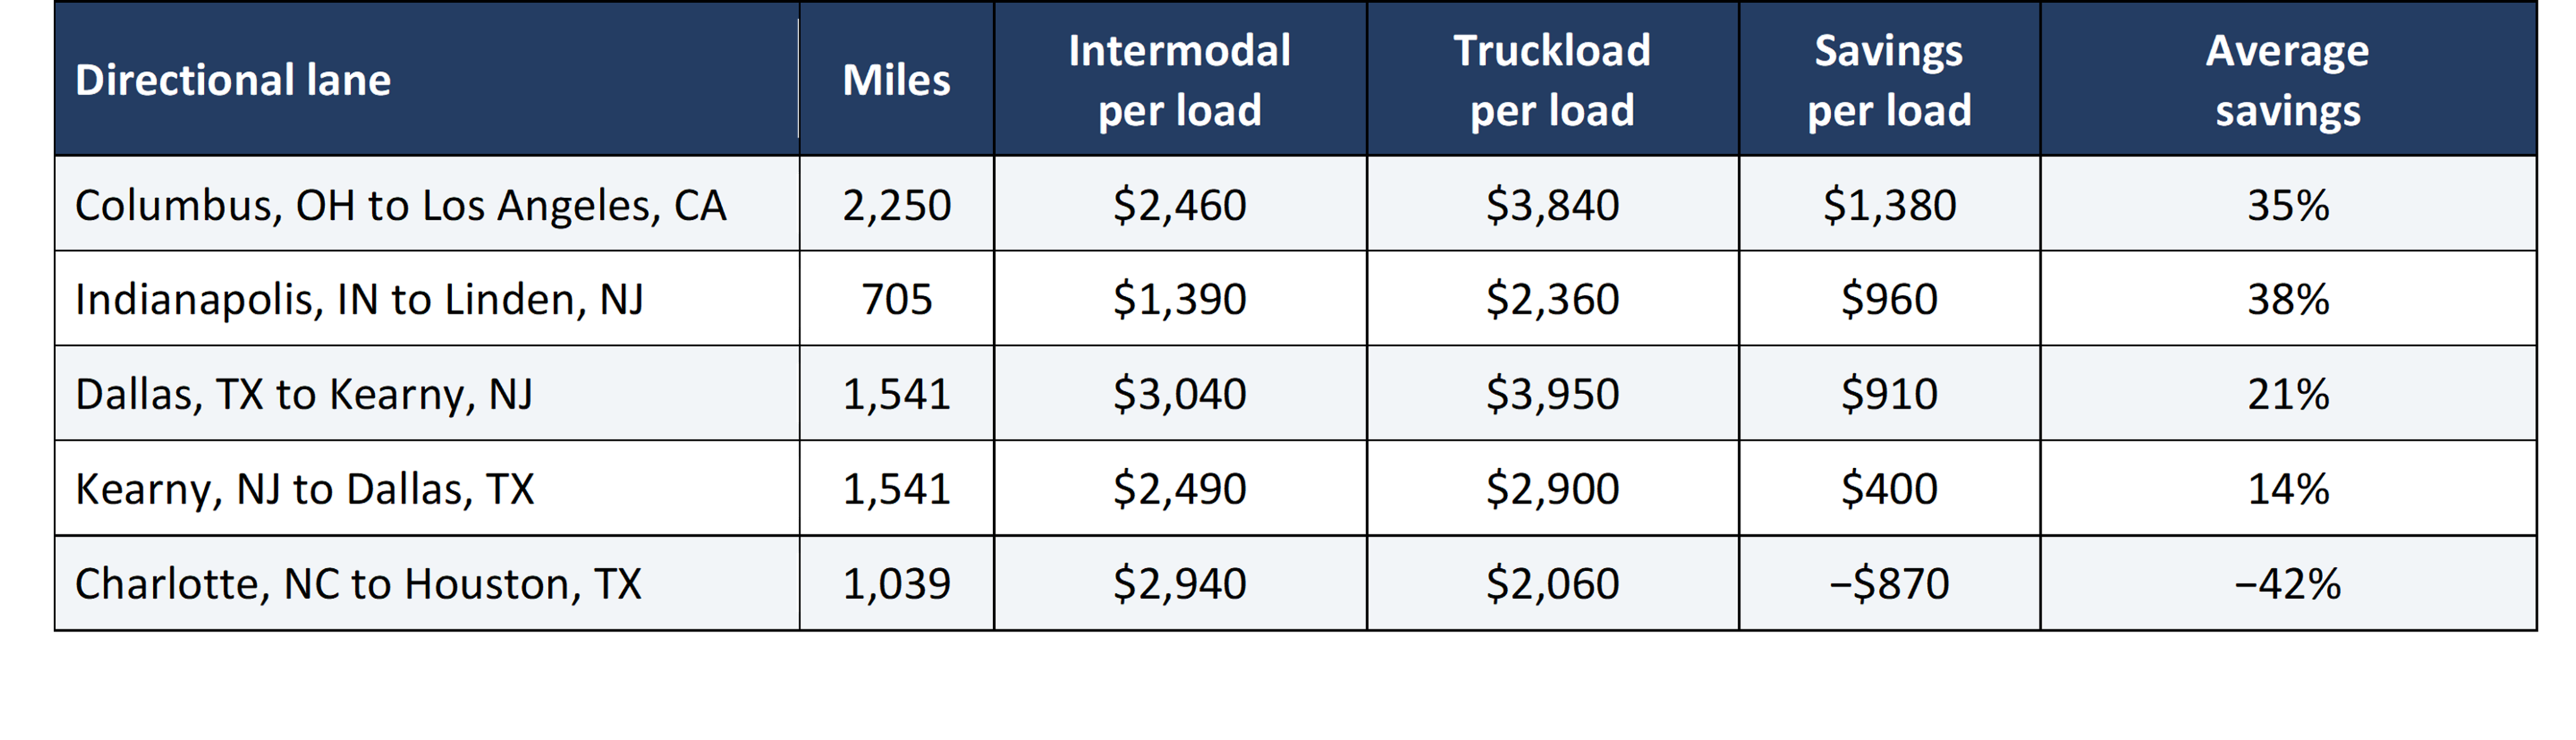 Note: Negative savings mean intermodal costs more. Average savings percentages are calculated separately from average dollar differences. Rounded rates may not subtract to the displayed difference; see the methodology.
A long lane with substantial savings
Columbus to Los Angeles averaged about $1,380 less per load by intermodal. It saved in all four observations: average savings were about 30% in the two 2025 months and 41% in 2026. The lane illustrates an opportunity that persisted in both markets and strengthened in the tighter one.
A short lane worth reviewing
Indianapolis to Linden averaged about $960 less per load despite being only 705 miles. It also saved in all four observations, with average savings of about 25% in the two 2025 months and 52% in 2026. It merits an individual review, even though most lanes in its mileage band cost more by intermodal.
Market balance affects the opportunity
Dallas to Kearny averaged about $910 in savings per load, compared with $400 from Kearny to Dallas. The comparison illustrates how pricing can differ between the same two markets. A shipper only needs to evaluate the movements it actually makes.
Some markets receive more containers than they ship out. Outbound loads that help reposition that surplus toward a market needing equipment can attract favorable intermodal rates. Headhaul and backhaul conditions affect truckload pricing too, so the savings depend on the relative balance of the two networks. The study measured rate differences, rather than equipment balances.
A lane where truckload costs less
Charlotte to Houston cost more by intermodal in all four observations, averaging a premium of about $870 per load. Its 1,039-mile distance did not ensure savings, even in the tighter market. A lasting intermodal strategy depends on selecting suitable lanes and retaining truckload where it is the better fit.
Use distance to set priorities, then assess how the shipper’s actual lanes fit current pricing, equipment availability, and service requirements.
A recurring intermodal program must deliver value in total cost and service. Apply the current rate advantage only to eligible shipments, then deduct added costs outside the quoted rate to reach an accurate estimate. Evaluate the lane over the proposed program period, including a narrower savings scenario if truckload pricing softens.
Illustrative annual savings
Using the Columbus to Los Angeles example, three eligible loads per week for 50 weeks would produce the following estimate. The cost allowances are hypothetical and should be replaced with the shipper’s own figures.
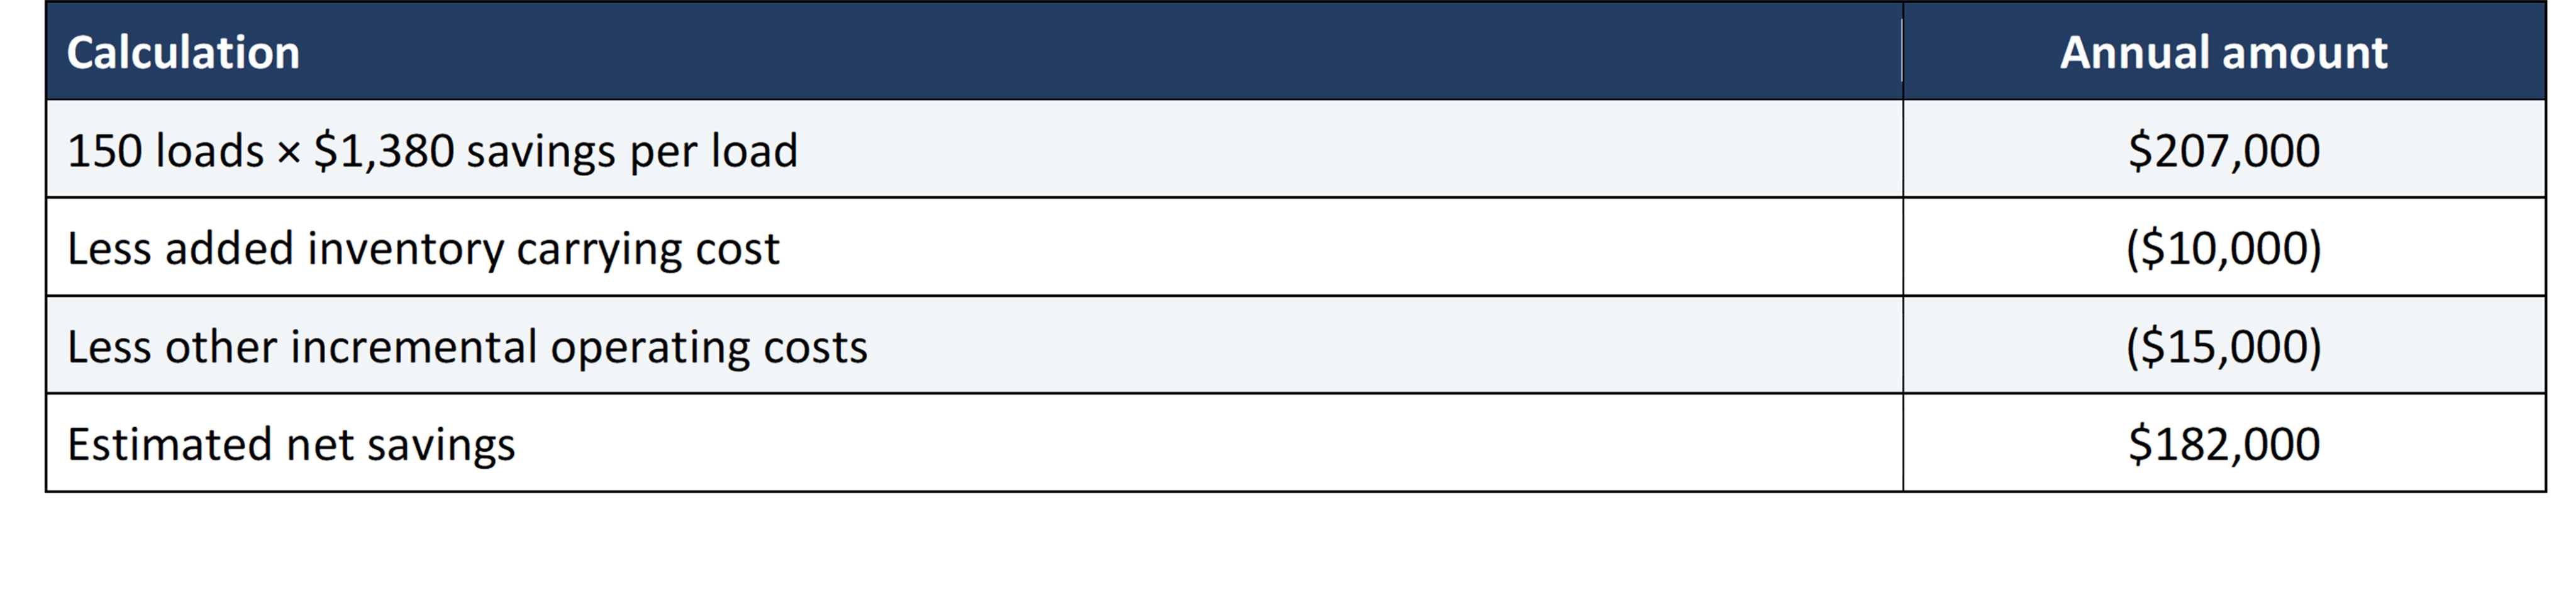
Inventory carrying cost depends on cargo value, the carrying rate, and added transit days. Other costs may include accessorials or operating changes caused by the mode switch. Drayage is already included in the study rates and should not be deducted again.
Plan service around recurring freight
InTek’s operating approach is to establish repeatable pickup, rail cutoff, and delivery processes around expected volume. Forecast visibility helps providers plan equipment and local trucking, while repeated shipments let drivers and operations teams learn dock requirements and resolve recurring problems. This gives a program a stronger basis for consistent service than isolated requests made only when truckload is difficult to secure. [5, 6]
- Transit and appointments. Confirm delivery windows, expected variability, rail cutoffs, and the response to a missed connection or appointment.
- Drayage and dock access. Review terminal distance, loading and unloading practices, drop needs, and restrictions at both docks.
- Commodity and equipment. Check weight, loading configuration, and handling needs against the proposed container and chassis.
- Volume and shipment management. Agree on weekly forecasts, seasonal changes, shipment visibility, and responsibility for exceptions.
Test a small group of qualifying lanes with recurring volume over a defined period, such as a quarter. Compare total cost and delivery performance with the truckload baseline, address startup issues, and use those results to decide where to expand the program.
Note: The rate study did not measure service improvement. These operating recommendations reflect InTek’s published experience and should be tested through the shipper’s own program.
Request a lane review
Send InTek your origin and destination ZIP codes, shipment volumes, current cost and included charges, commodity and weight, and delivery and dock requirements. InTek can use those inputs to prioritize lanes, estimate savings, and identify service considerations.
Begin at inteklogistics.com/request-a-quote.

Study scope
InTek Logistics compiled U.S. directional lanes with matched intermodal and truckload spot rates for April and May of 2025 and 2026. Both rates include door-to-door transportation and fuel. Canadian lanes were excluded, city-name capitalization was standardized, and duplicate lane records were removed. The matched dataset contains a little over 600 lanes, with four monthly observations per lane.
How savings were calculated
For each monthly observation, percentage savings equal the truckload rate minus the intermodal rate, divided by the truckload rate. Each lane’s reported savings percentage is the average of its four monthly percentages. Rates and dollar differences are also averaged separately. Dividing average dollar savings by the average truckload rate may therefore produce a different percentage. Rounding can also cause displayed rates and differences to vary slightly.
Each lane receives equal weight, regardless of shipment volume. A threshold such as “at least 8% savings” refers to a lane’s average across the four observations unless stated otherwise. Thresholds overlap: a lane saving 20% also qualifies at 8% and 15%.
Consistency and limitations
Across the lanes studied, 415 cost less by intermodal in all four months, 48 cost more in all four, and 166 switched. Using each year’s two-month average, 452 lanes favored intermodal in both years. Their equally weighted savings averaged 21.6% in 2025 and 30.4% in 2026. Another 67 favored truckload in both years, 97 shifted from favoring truckload to intermodal, and 13 shifted the other way. Savings improved on 525 lanes.
While 74% of lanes averaged at least 8% savings, 54% met that threshold in every observation. This stricter test differs from whether intermodal simply cost less. Monthly and annual summaries use the same matched lanes and equal lane weights.
Comparing the same calendar months reduces seasonal differences, but four observations do not establish a continuous trend or capture all market conditions. The study does not measure service performance, actual customer conversions, or contract savings. The observed lanes are not a representative sample of every shipper’s network. Current pricing and operational review are needed before committing volume.
Table A1: Results by mileage
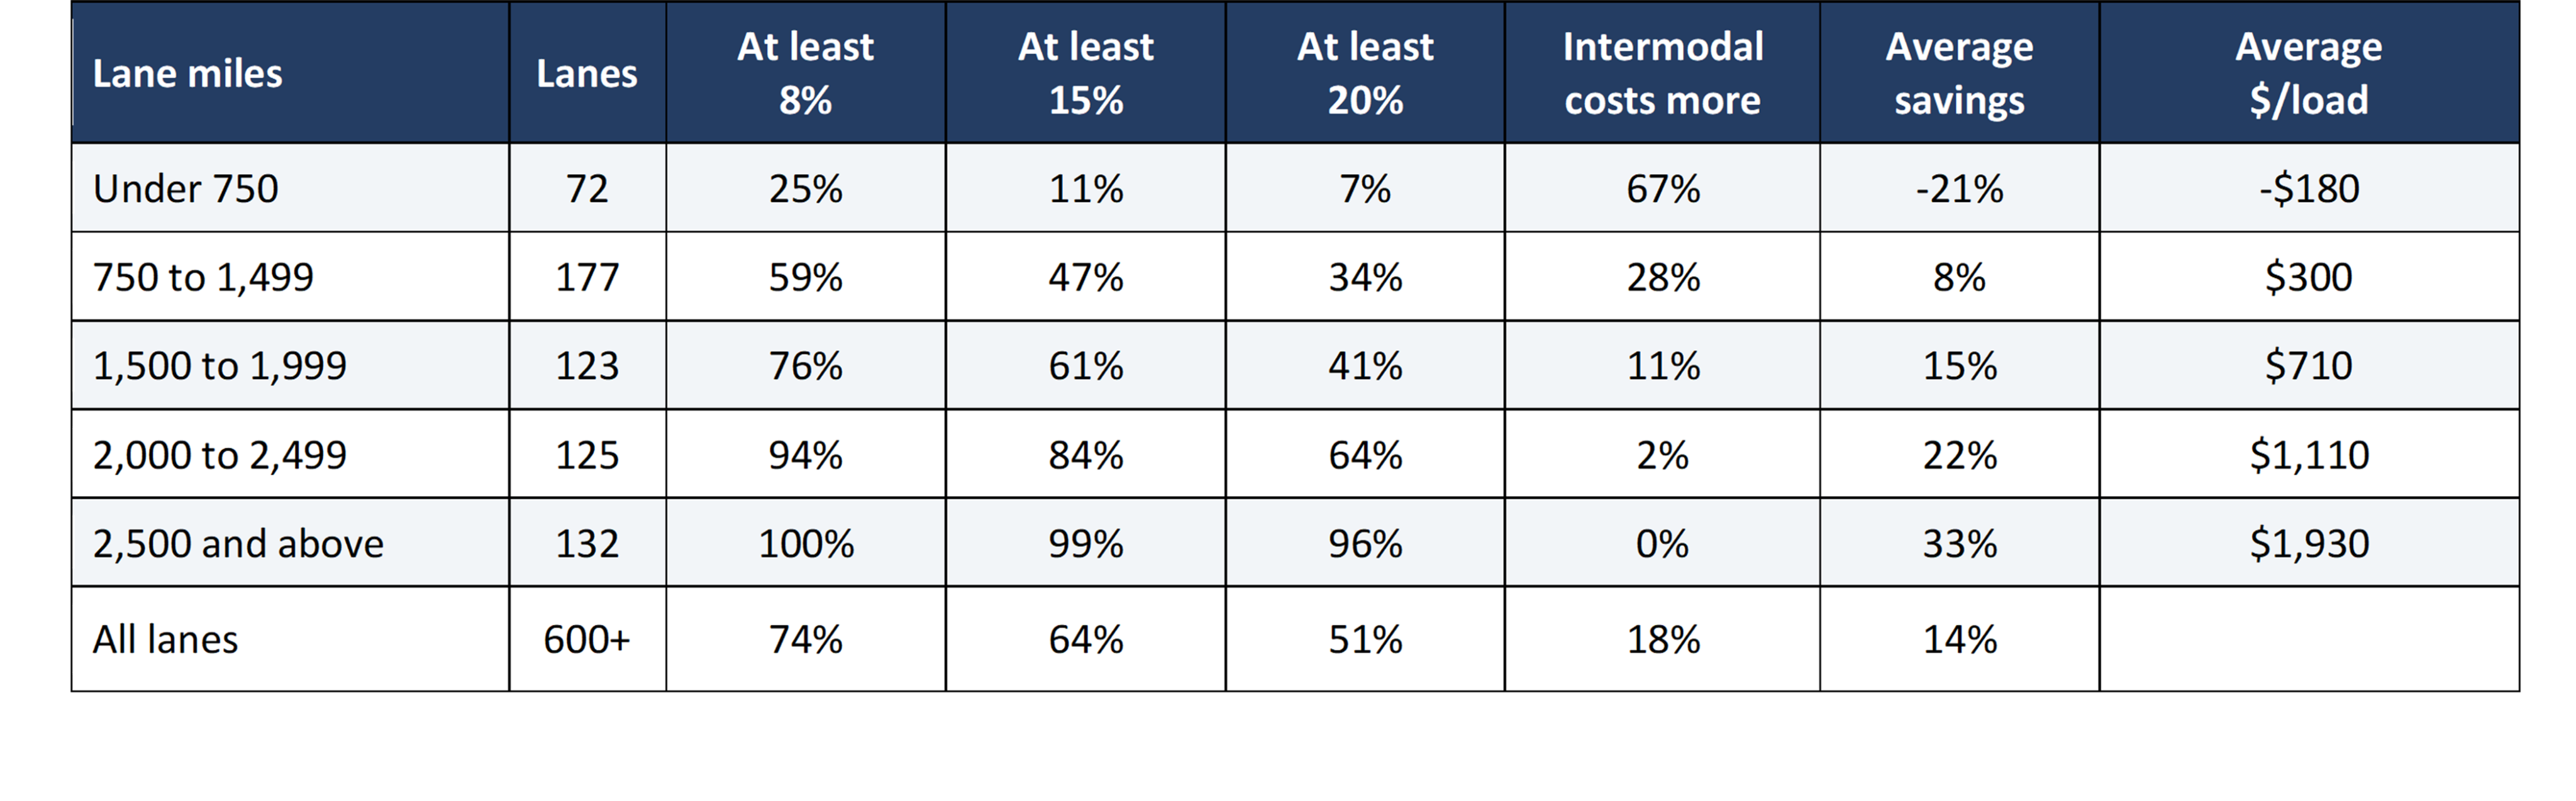
Threshold columns show the share of lanes meeting each average savings level. Dollar figures are average truckload rates less average intermodal rates. Negative values indicate an intermodal cost premium. Source: InTek Logistics.
Table A2 shows directional corridors with at least 10 lanes. It illustrates how results differed within and across mileage bands. A corridor average does not establish the price available on an individual lane.
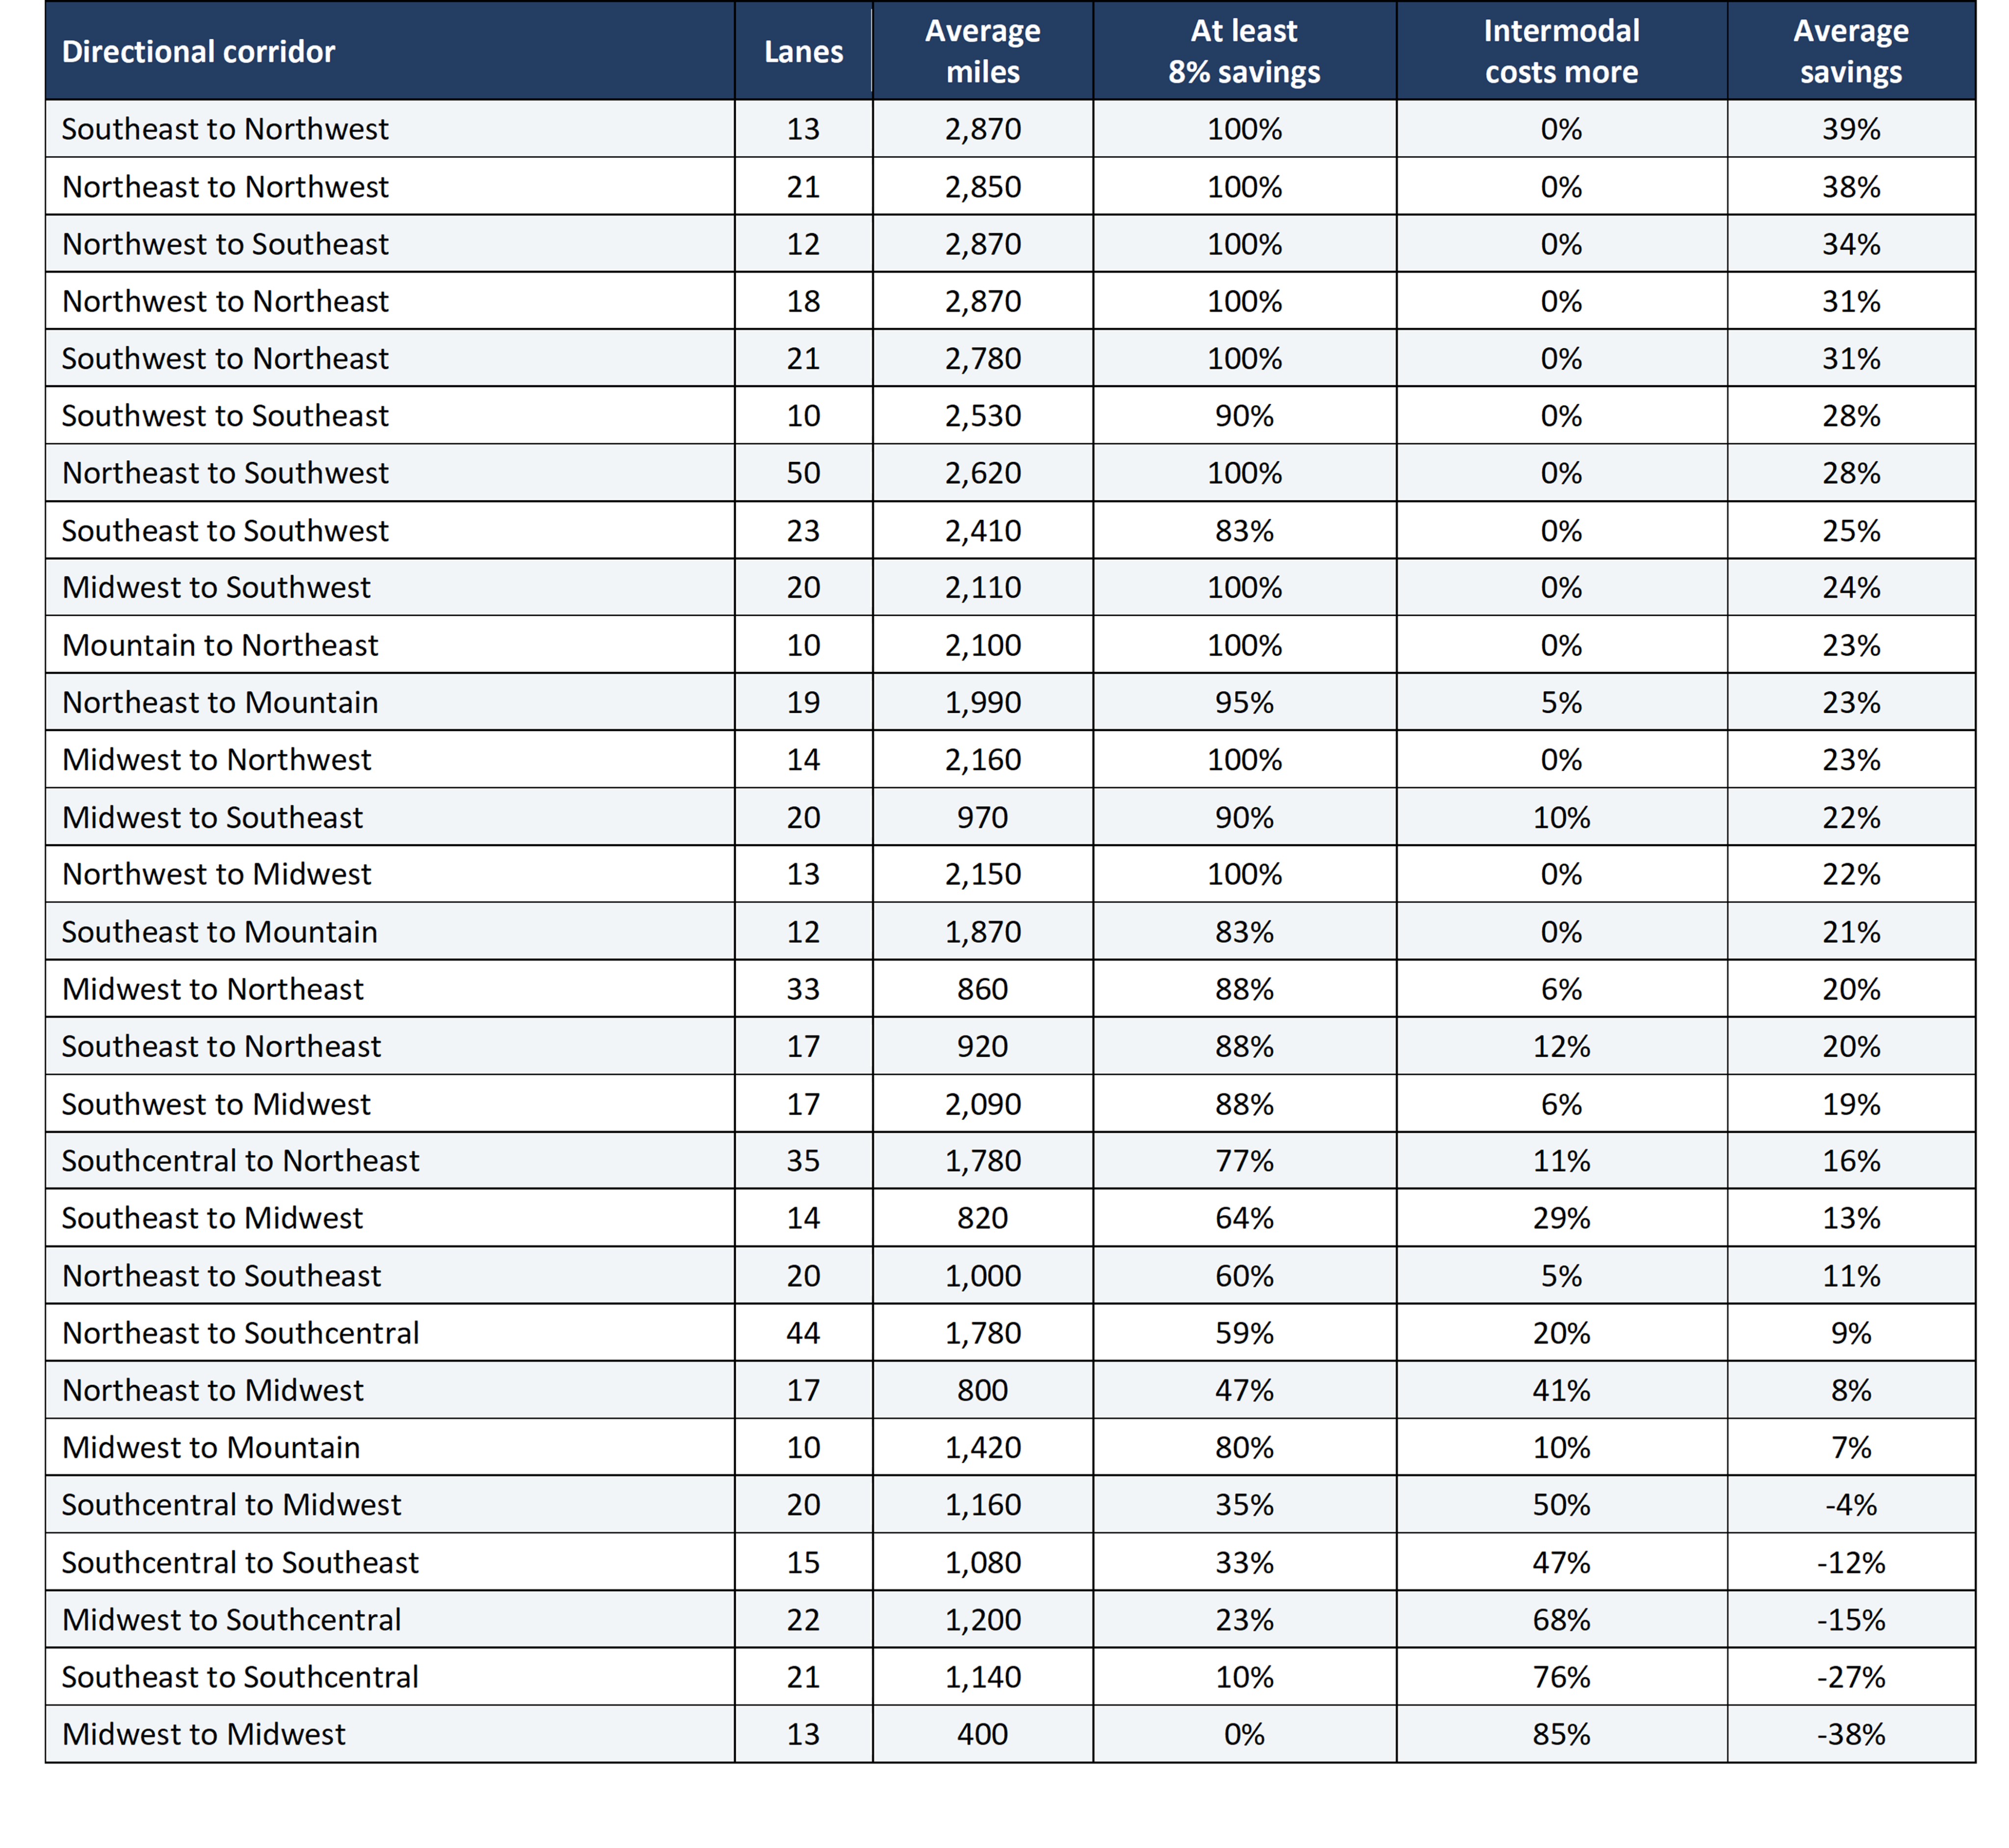
Note: Regions follow the source files. Southcentral includes Texas, Louisiana, and the Gulf; Southwest includes California, Nevada, and Arizona; Northwest includes Oregon and Washington. Results apply to the corridors listed. Source: InTek Logistics expanded spot rate workbooks for April and May 2025 and April and May 2026.
Market context sources
- [1] DAT A capacity driven recovery looks different than everyone expected August 3 2026
- [2] DAT Typical May truckload rates and volumes masked tariff turmoil June 20 2025
- [3] DAT Truckload volumes and rates slipped in April May 9 2025
- [4] DAT Spot truckload rates rise in May on capacity pressure June 16 2026
- [5] Rick LaGore Intermodal is Not a Spot Truck September 14 2026
- [6] InTek Logistics The Role of IMCs in Intermodal Logistics for Shippers March 18 2026
Table A3 shows 10 lanes with average savings between 15% and 25% and 10 with average cost premiums between 15% and 25%. The lanes selected were closest to positive or negative 20% in each group. These examples illustrate moderate outcomes on both sides; they are not a representative sample.
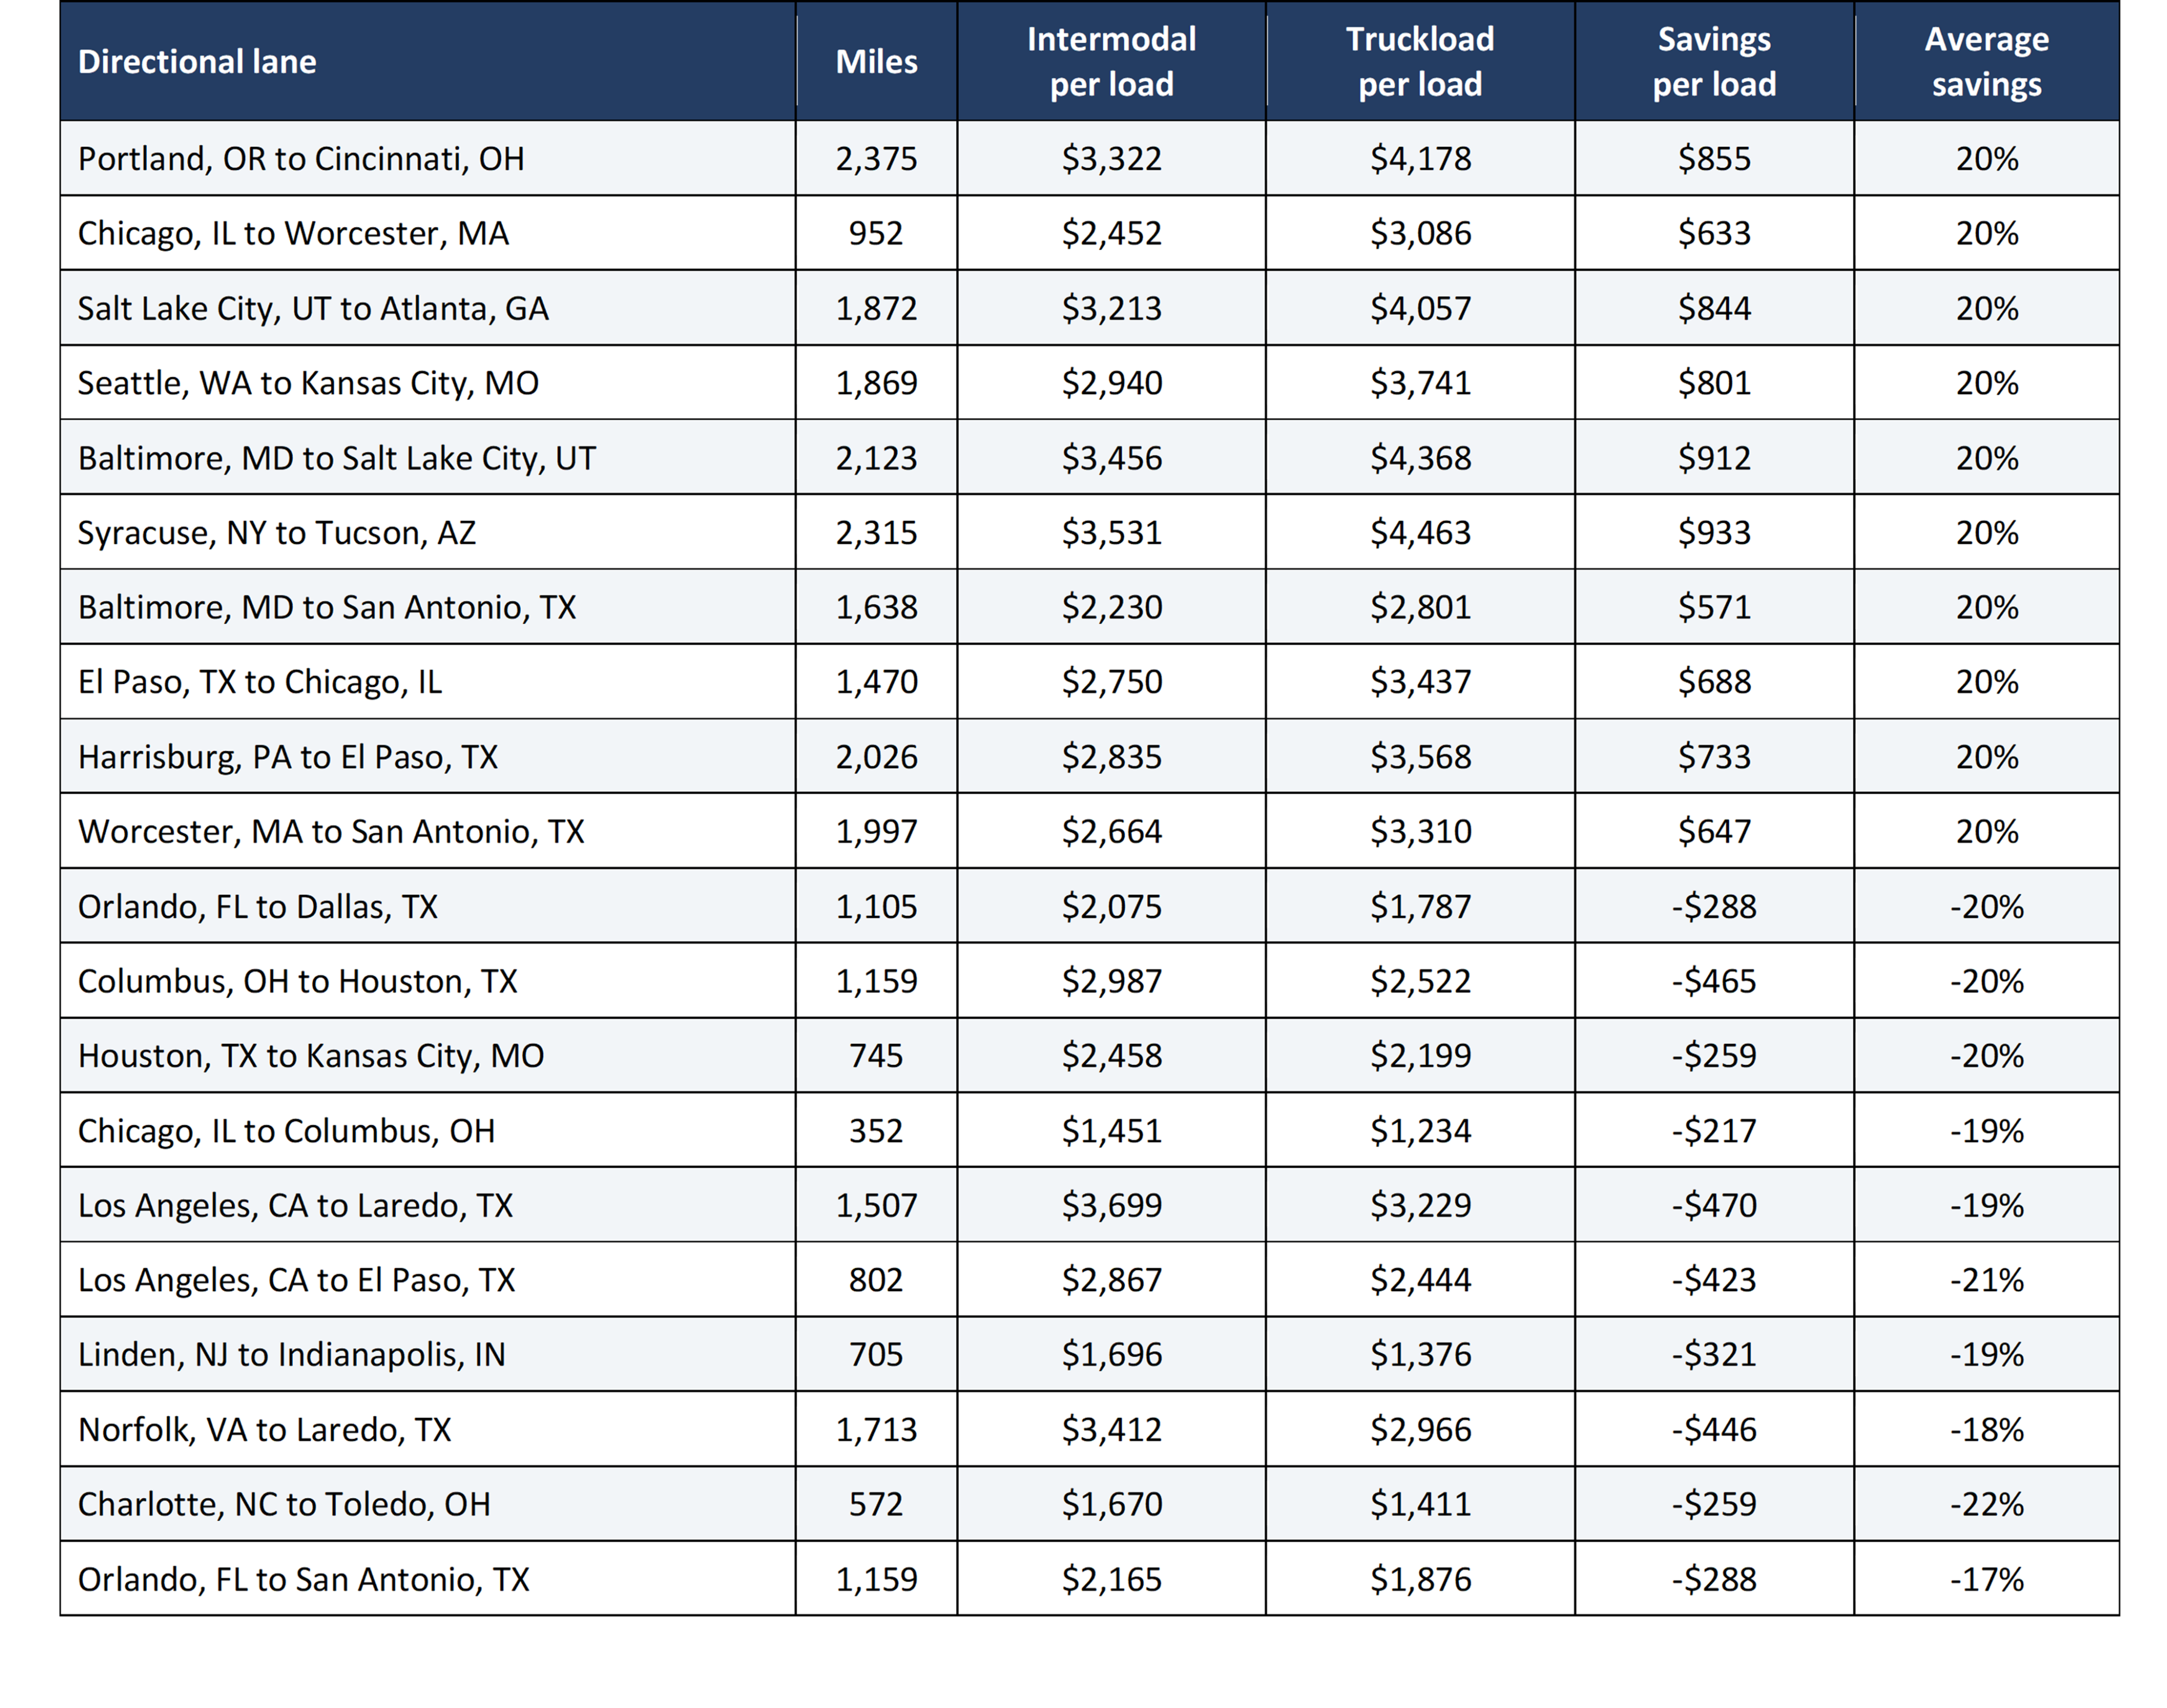
Note: Rates are average door-to-door spot rates, including fuel. Negative savings indicate that intermodal cost more. Percentages are averages of monthly savings percentages and may differ from the ratio of the displayed average rates. Source: InTek Logistics.
Linden to Indianapolis had an average cost premium, while Indianapolis to Linden showed savings. These differences reflect the pricing available for each movement; a shipper’s review should focus on the lanes it actually uses.
Note: Across the lanes studied, 516 averaged savings and 113 averaged an intermodal cost premium. Savings counts were 52 below 8%, 61 from 8% to 15%, 182 from 15% to 25%, and 221 above 25%. Cost-premium counts were 31 below 8%, 15 from 8% to 15%, 20 from 15% to 25%, and 47 above 25%. These counts describe the study population, rather than probabilities for an unpriced lane.
Want to add value to your business with intermodal?