
<img alt="" src="https://secure.perk0mean.com/182585.png" style="display:none;">

red-accent


InTek Intermodal Index (III) Week Ending May 4, 2026

InTek Intermodal Index (III) Logo


Weekly market intelligence including the InTek Intermodal Index (tracking intermodal spot rates), along with truckload pricing, diesel trends, and railroad volumes - Historical Edition


Back to the archive

View the current edition

Get an intermodal quote

About-Hero-curve-1

This Week at a Glance

Week ending May 4, 2026

Train Truck Background Sketch-Light-Even

This Week's Analysis

By Rick LaGore, CEO, InTek Logistics | May 4, 2026

Analysis of the InTek Intermodal Index (III) and freight market trends

Trends in the Intermodal Transportation Spot Rate and Market

Five straight weeks of intermodal spot rate improvement, while truckload spot rates are back to climbing alongside them. In addition, U.S. intermodal volumes moved into positive year-over-year territory for the first time in 2026

That is a meaningfully different set of data points than what we were discussing just six weeks ago. The question now is whether the trend has staying power.

InTek Intermodal Index (excluding fuel):

  • Up 0.6% vs. prior week
  • Down 4.5% vs. prior year

The InTek Intermodal Index, which tracks domestic intermodal spot rates, has now seen five straight weeks of gains. The year-over-year deficit has narrowed from -8.4% at its late-March low to -4.5% this week.

The pace of improvement moderated slightly this week, up 0.6% versus 1.2% last week, but that is not concerning. Trends rarely move in a straight line. What matters is that intermodal was higher for again - with truckload rejoining that upward move. Both modes firming together is the confirmation signal this framework has pointed toward for months.

National Truckload Spot Rate (DAT, excluding fuel): (DAT Trendline Report)

  • Up 1.3% vs. prior week
  • Up 4.5% vs. prior year

Truckload reversed last week’s modest pullback and moved higher. With both intermodal and truckload posting week-over-week gains in the same reporting period, we may be seeing early signs that freight demand is beginning to improve at the same time truckload capacity continues to tighten under increasing FMCSA regulatory enforcement.

Gas Pump Sketch Light

Diesel Fuel (EIA):

  • $5.64/gallon
  • Up $0.289 (5.4%) vs. prior week
  • Up $2.143 (61.3%) vs. prior year

After easing from $5.643 to $5.351, diesel reversed sharply this week, rising $0.289 to $5.640, essentially back to the April peak and within $0.17 of the 2022 record high.

The same issue continues driving the market: geopolitical risk in the Middle East is keeping crude and diesel highly volatile. The brief decline created hope that costs were stabilizing. This week’s reversal suggests otherwise.

For smaller carriers, the expected margin relief never materialized. And for shippers, any freight models built around moderating fuel costs over the past two weeks now need to be revisited.

At this point, planning assumptions should shift toward diesel remaining elevated through much, if not all, of 2026, with periodic spikes still very possible as global energy markets continue reacting to geopolitical instability and supply disruption risk.

Even if the Strait of Hormuz were fully reopened today and tensions eased immediately, diesel would still likely take months to normalize. Global oil markets do not reset overnight. Crude already purchased at elevated prices is still moving through the supply chain; refiners are still processing higher-cost inventory; and fuel distributors and carriers are still operating under contracts and replenishment cycles established during the spike.

In addition, the market now understands how fragile global energy flows through the region really are, meaning a geopolitical risk premium is likely to remain embedded in crude pricing well after any immediate disruption ends.

(The full spreadsheet of the historical weekly price moves of diesel full can be found at https://www.eia.gov/petroleum/gasdiesel.)


Year-to-Date Intermodal Volume by Region and Railroad vs. 2025

U.S. intermodal volumes crossed into positive territory this week at +0.2%. The number itself is small, but the shift is not.

As recently as early March, U.S. intermodal volumes were running at a -8.8% year-over-year deficit. Moving from -8.8% to positive territory in roughly seven weeks marks one of the sharpest recoveries this report has tracked. The open question remains whether this trend continues to hold.

North American intermodal held steady at +0.5%, signaling stabilization at improved levels rather than a short-term spike. That is generally a healthier pattern.

The broader takeaway is that intermodal volumes have now held at or near flat-to-positive territory for three consecutive weeks after months of deep deficits. Each week volumes hold strengthens the case for a more durable recovery.

North American Intermodal

0.5%

U.S. Intermodal

0.2%

Volume by Class 1 Railroad

BNSF 2.5%
CN 0.1%
CPKC -2.6%
CSX 4.5%
GMXT 21.5%
NS 1.3%
UP -7.5%


Dark-blue-curve-up

Intermodal Spot Rate Trend Charts

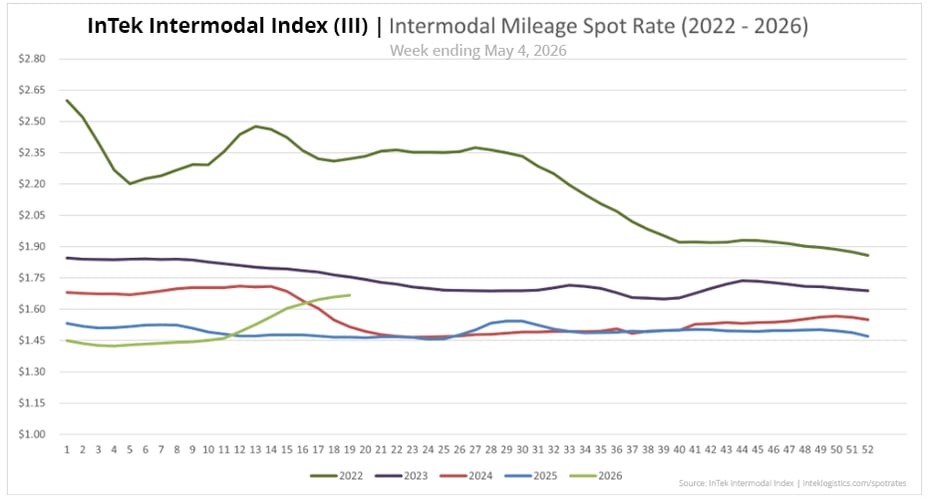
InTek Intermodal Index (III) spot rate per mile including fuel, showing weekly trends

Intermodal Spot Rate Per Mile (Including Fuel)
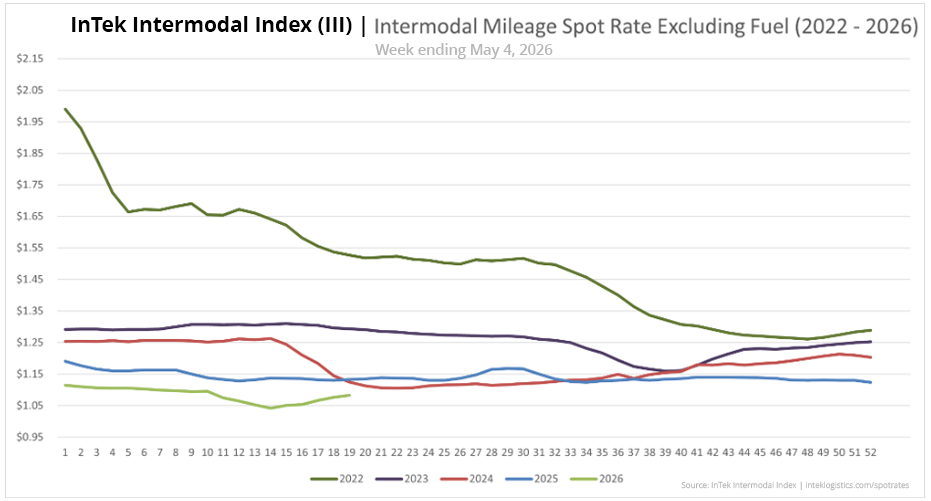
  

InTek Intermodal Index (III) spot rate per mile excluding fuel, showing weekly trends

Intermodal Spot Rate Per Mile (Excluding Fuel)
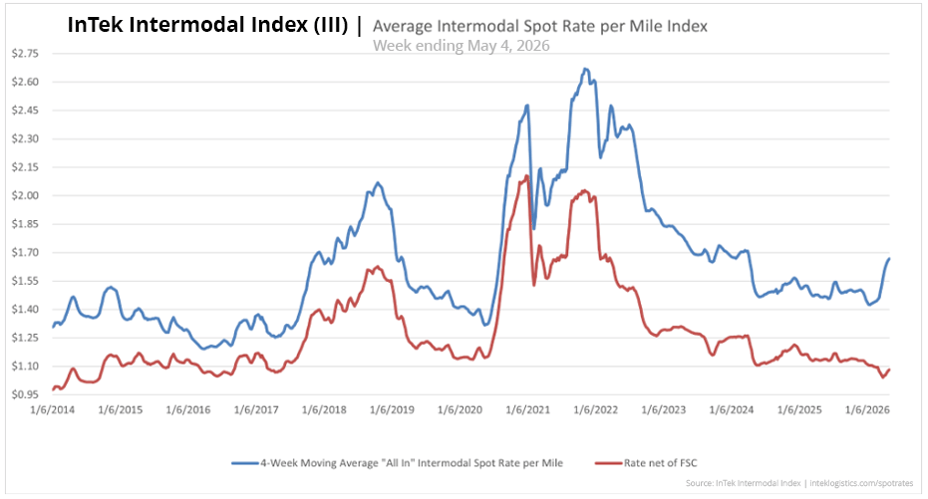
 

InTek Intermodal Index (III) average intermodal spot rate per mile from 2021 to 2026 Intermodal Spot Rate Average Per Mile (2014-2026)
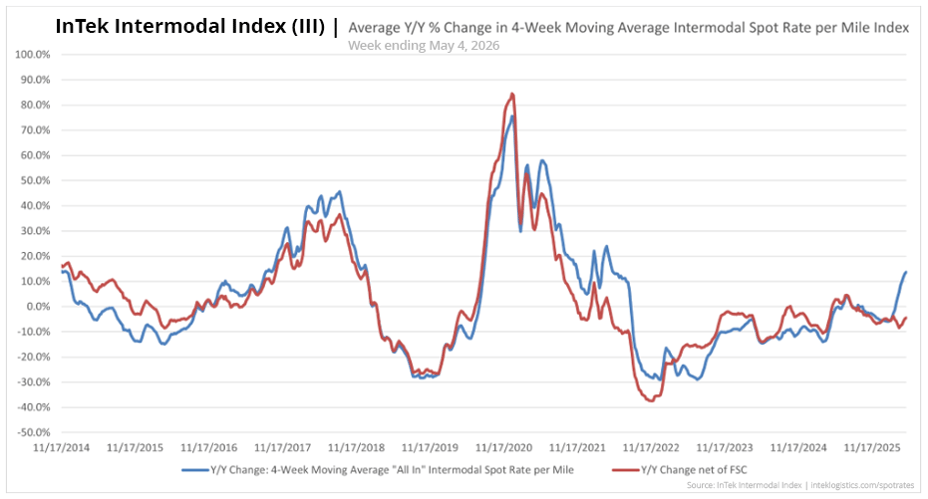
InTek Intermodal Index (III) average intermodal percentage rate change per mile from 2021 to 2026

Intermodal Spot Rate Y/Y % Change (2014-2026)

medium-blue-curve-down-right

What to watch next week

Three things to watch heading into the week of May 11, 2026.

Last week's scorecard

Last week we flagged three things. Here is how they played out.

  • Intermodal posted a fifth consecutive week-over-week gain. What initially appeared to be a developing trend is now becoming established.

  • Diesel did not hold below $5.40. It reversed sharply, climbing $0.289 back to $5.640. The brief two-week pullback is over, and the 2022 record high is now just $0.170 away.

  • Volumes continued improving. U.S. intermodal moved into positive year-over-year territory for the first time in 2026, suggesting the feared pull-forward fade did not materialize in this week’s data.

About the InTek Intermodal Index:

The InTek Intermodal Index (III) tracks weekly domestic intermodal spot rates on a per-mile basis, both including and excluding fuel surcharges. Each week's report includes comprehensive market analysis covering truckload pricing trends, diesel fuel costs, and Class I railroad intermodal volumes to provide context for rate movements.

Published every Thursday since 2014, the Index serves as a resource for shippers, carriers, and industry analysts tracking North American freight market trends.

Citation: InTek Intermodal Index. (2026). Weekly Intermodal Spot Rate Report. Retrieved from https://www.inteklogistics.com/spot-rates

Divider


Want custom pricing for your lanes?

Get a tailored intermodal quote based on your specific shipping needs and freight profile.