
![]()
InTek Intermodal Index (III) Week Ending May 18, 2026

Weekly market intelligence including the InTek Intermodal Index (tracking intermodal spot rates), along with truckload pricing, diesel trends, and railroad volumes - Historical Edition
This Week at a Glance
Week ending May 18, 2026
Intermodal Spot Rate
(excluding fuel)
▲ +0.1% vs. last week
▼ -4.2% vs. last year

Truckload Spot Rate
(excluding fuel, DAT)
▼ -1.7% vs. last week
▲ +4.5% vs. last year

Diesel Fuel
(EIA National Average)
▼ -0.8% vs. last week
▲ +58.3% vs. last year

Intermodal Volume
(YTD vs. 2025)
U.S. ▲ +0.7%
North American ▲ +0.7%

This Week's Analysis
By Rick LaGore, CEO, InTek Logistics | May 18, 2026
Analysis of the InTek Intermodal Index (III) and freight market trends
Trends in the Intermodal Transportation Spot Rate and Market
Seven consecutive weeks of intermodal spot rate improvement, with some nuances.
Truckload pulled back, while intermodal barely moved. Diesel edged lower for the second consecutive week. And volumes held positive year-over-year, with one notable shift in the railroad breakdown worth paying attention to.
The market is not reversing. But it is giving mixed signals for the first time since the current trend began in late March.
InTek Intermodal Index (excluding fuel):
- Up 0.1% vs. prior week
- Down 4.2% vs. prior year
The streak is intact. The InTek Intermodal Index, which tracks domestic intermodal spot rates, has now seen seven consecutive weeks of week-over-week gains. After six weeks of consistent improvement ranging from 0.6% to 1.9%, this week's reading is a meaningful deceleration in pace coming on at being up 0.1%.
The year-over-year comparison worsened slightly from -4% to -4.2%. But one week of near-flat does not end a trend. However, it does raise the question of whether the rate recovery is pausing to consolidate or running out of steam. Next week's reading will carry more weight than usual in answering that.
National Truckload Spot Rate (DAT, excluding fuel): (DAT Trendline Report)
- Dowm 1.7% vs. prior week
- Up 4.5% vs. prior year
Truckload spot rates pulled back after two consecutive weeks of gains.
The year-over-year comparison holds at +4.5% for the third straight week, which reflects where truckload rates were a year ago as much as it reflects current market strength. The week-over-week softness is consistent with a supply-driven rally that does not move in a straight line.
Capacity is still leaving the market. FMCSA enforcement pressure has not eased. The structural conditions that have been tightening truckload supply remain in place. One down week does not change that picture.
What it does change is the joint confirmation read. Two weeks of both modes moving together was the strongest signal this framework produced. This week, truckload faded while intermodal held. That is not the configuration that declares a demand-led recovery. It keeps the supply-driven interpretation intact as the primary explanation for current rate behavior.
Diesel Fuel (EIA):
- $5.60/gallon
- Down (0.8%) vs. prior week
- Up $2.06 (58.3%) vs. prior year
Diesel declined for the second consecutive week. Modest, but the direction has now held for two straight EIA readings. From the near-peak of $5.640 two weeks ago, diesel has pulled back $0.044 to $5.596.
The price at the pump is still 58.3% above year-ago levels. Still well above the pre-March baseline that most carrier and shipper cost models were built around. Still close enough to the 2022 record of $5.810 that a single escalation in the Middle East reopens that conversation immediately.
What two consecutive weeks of modest decline does offer is a tentative signal that the relentless climb that defined March and early April may have plateaued.
Tentative is the operative word, as the geopolitical dynamics driving crude markets have not been resolved.
For carriers still absorbing the margin impact of operating at $5.60+ diesel for nine consecutive weeks, a $0.044 weekly decline does not move the needle on operational decisions. Capacity that has already exited the market does not return on a modest fuel pullback. The supply tightening that has been building since early March is baked in regardless of where diesel goes from here in the short term.
(The full spreadsheet of the historical weekly price moves of diesel full can be found at https://www.eia.gov/petroleum/gasdiesel.)
Year-to-Date Intermodal Volume by Region and Railroad vs. 2025
Volumes held positive and the U.S. number improved. Both worth noting. One shift in the railroad data is worth watching closely.
North American intermodal ticked up to +0.7%. The U.S. moved from +0.4% to +0.7%, the strongest U.S. reading of the current recovery. Four consecutive weeks of positive year-over-year U.S. intermodal volumes against a 2025 baseline that included significant tariff-driven pull-forward activity. That combination continues to be a more constructive signal than the raw percentages suggest on their own.
The railroad-level data is broadly stable with one notable exception. GMXT dropped from +21.8% to +13.3% in a single week. That is a significant moderation after four consecutive weeks above 20%. Cross-border Mexico freight activity had been running at extraordinary levels, almost certainly reflecting supply chain repositioning in response to the tariff environment.
A move from +21.8% to +13.3% is still a strong positive reading, but the pace of that activity appears to be normalizing. Whether this is a one-week adjustment or the beginning of a sustained moderation in cross-border volumes is the most important thing to watch in next week's railroad data.
The rest of the network held largely steady.
North American Intermodal
0.7%
U.S. Intermodal
0.7%
Volume by Class 1 Railroad
| BNSF | 3% |
| CN | -0.4% |
| CPKC | -2.4% |
| CSX | 4.5% |
| GMXT | 13.3% |
| NS | 1.7% |
| UP | -6.4% |
Intermodal Spot Rate Trend Charts
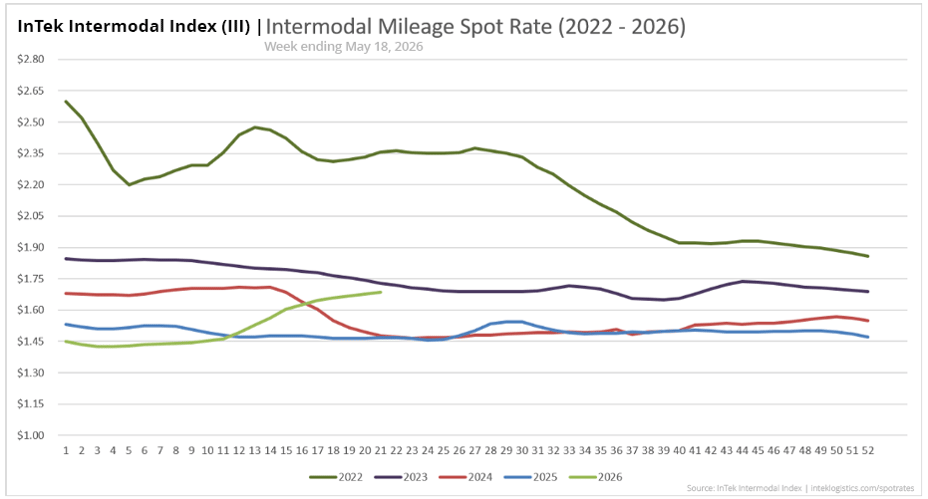
Intermodal Spot Rate Per Mile (Including Fuel)
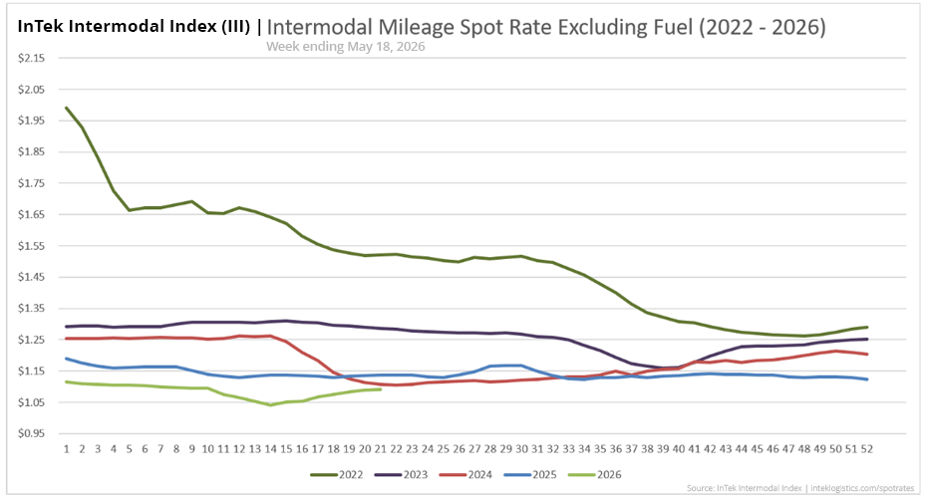
Intermodal Spot Rate Per Mile (Excluding Fuel)
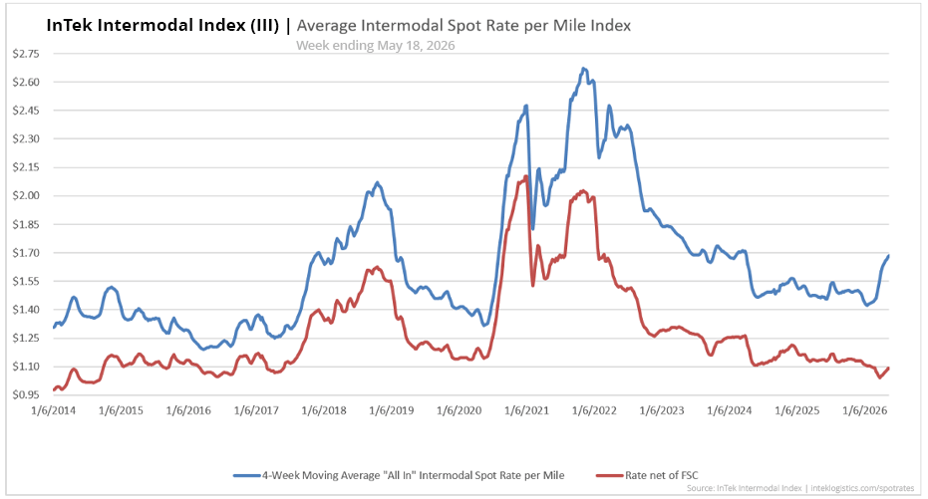
Intermodal Spot Rate Average Per Mile (2014-2026)
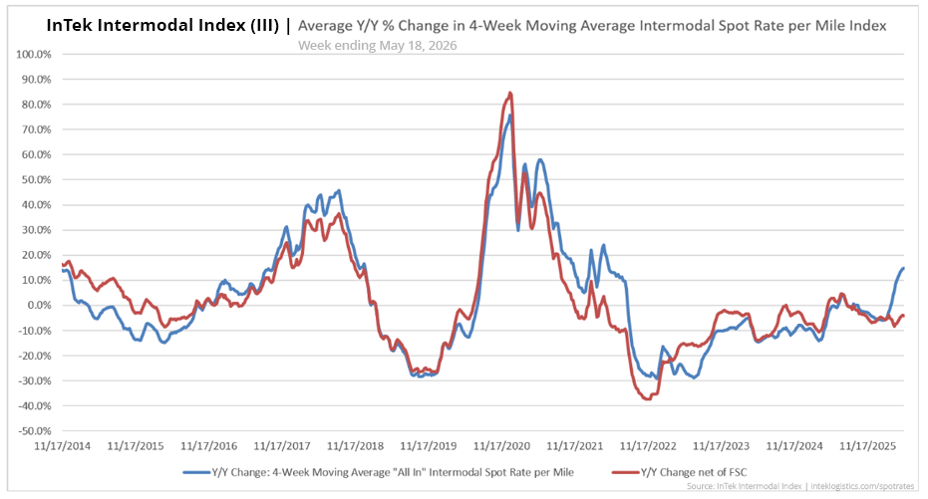
Intermodal Spot Rate Y/Y % Change (2014-2026)

What to watch next week
Three things to watch heading into the week of May 25, 2026.
Does intermodal extend the streak to eight consecutive weeks?
A 0.1% gain kept the seven-week streak alive, but barely. Whether intermodal resumes meaningful week-over-week improvement or slips into negative territory for the first time since late March will set the tone for how the market reads June. A resumption of gains alongside any truckload firming would restore the joint confirmation signal. A decline would be the first break in the trend since it began.

Does the GMXT moderation continue or stabilize?
The drop from +21.8% to +13.3% is the most significant single-week shift in the railroad data in several weeks. Cross-border Mexico freight has been the strongest and most consistent positive in this report. Whether that moderation reflects a natural normalization after an extraordinary run or signals something more structural in trade flow patterns is the key question heading into the final week of May.

Does diesel hold its modest decline through a third consecutive week?
Two weeks of easing after nine weeks at or above $5.60 is a pause, not a trend. A third consecutive week of decline would begin to look more like a genuine directional shift and would start to provide real, if modest, relief to carrier margin structures that have been under sustained pressure since early March.

Last week's scorecard
Last week we flagged three things. Here is how they played out.
-
The joint IM and TL spot rate confirmation did not extend to a third consecutive week. Truckload pulled back 1.7% while intermodal posted a near-flat 0.1% gain. The supply-driven interpretation of current rate behavior remains the primary read.
-
Diesel continued its modest decline for a second consecutive week. Down $0.043 to $5.596. The relentless climb from March appears to have paused. Not resolved, but the direction held for two straight readings.
-
Volumes held positive and improved. U.S. intermodal moved to +0.7% year over year, the strongest reading of the current recovery. Four consecutive weeks of positive U.S. volumes against a pull-forward-inflated 2025 baseline.
About the InTek Intermodal Index:
The InTek Intermodal Index (III) tracks weekly domestic intermodal spot rates on a per-mile basis, both including and excluding fuel surcharges. Each week's report includes comprehensive market analysis covering truckload pricing trends, diesel fuel costs, and Class I railroad intermodal volumes to provide context for rate movements.
Published every Thursday since 2014, the Index serves as a resource for shippers, carriers, and industry analysts tracking North American freight market trends.
Citation: InTek Intermodal Index. (2026). Weekly Intermodal Spot Rate Report. Retrieved from https://www.inteklogistics.com/spot-rates
Want custom pricing for your lanes?
Get a tailored intermodal quote based on your specific shipping needs and freight profile.