
![]()
InTek Intermodal Index (III) Week Ending June 22, 2026

Weekly market intelligence including the InTek Intermodal Index (tracking intermodal spot rates), along with truckload pricing, diesel trends, and railroad volumes - Historical Edition
This Week at a Glance
Week ending June 22, 2026
Intermodal Spot Rate
(excluding fuel)
▲ +2.3% vs. last week
▲ +1.4% vs. last year

Truckload Spot Rate
(excluding fuel, DAT)
▼ -4.4% vs. last week
▲ +17.3% vs. last year

Diesel Fuel
(EIA National Average)
▼ -4.5% vs. last week
▲ +28% vs. last year

Intermodal Volume
(YTD vs. 2025)
U.S. ▲ +2.8%
North American ▲ +2.3%

This Week's Analysis
By Rick LaGore, CEO, InTek Logistics | June 22, 2026
Analysis of the InTek Intermodal Index (III) and freight market trends
Trends in the Intermodal Transportation Spot Rate and Market
For the first time since the freight recession began in mid-2022, the InTek Intermodal Index is positive year-over-year.
The index rose 2.3% on the week and now sits 1.4% above where it was a year ago. The floor that defined this cycle has become a recovery.
The driver is supply leaving the market rather than demand returning, and this week's crossing is intermodal making its final confirmation of a truckload move that has been building for months - though the fact that truckload didn't follow it up on a weekly basis bears watching.
Helping both modes is a continued pullback of diesel, which is under $5 for the first time in two months.
InTek Intermodal Index (excluding fuel):
- Up 2.3% vs. prior week
- Up 1.4% vs. prior year
This is the first positive year-over-year reading of the cycle for the InTek Intermodal Index - which tracks domestic intermodal spot rates.
It caps a 12 week run of weekly gains that carried the index up from a low near 8% below year-ago levels in late March. The crossing matters less as a single number than as a confirmation.
Intermodal lags truckload, so an intermodal recovery is the signal that the truckload move is broad rather than a fuel-driven spike.
National Truckload Spot Rate (DAT, excluding fuel): (DAT Trendline Report)
- Down 4.4% vs. prior week
- Up 17.3% vs. prior year
The weekly pullback is worth watching, but it does not break the trend. Truckload remains sharply higher than a year ago, and the year-over-year gap is the story.
Intermodal and truckload are now both positive year over year, the joint confirmation we look for before calling a turn.
Diesel Fuel (EIA):
- $4.83/gallon
- Down $0.227 (4.5%) vs. prior week
- Up $1.057 (28%) vs. prior year
Diesel has now fallen for seven straight weeks and has dropped back below $5.00, easing off the peak that followed the Middle East disruption.
The year-over-year gap, above 40% a month ago, has narrowed to 28% as the price comes down. Lower diesel helps both modes, and it pulls down the fuel surcharges layered on top of the ex-fuel rates quoted here.
(The full spreadsheet of the historical weekly price moves of diesel full can be found at https://www.eia.gov/petroleum/gasdiesel.)
Year-to-Date Intermodal Volume by Region and Railroad vs. 2025
Volume up low single digits, against rates that have now recovered to even, is the rate-versus-volume gap we have been tracking all cycle.
Price has recovered far faster than volume, which is the signature of a supply-led market: rates climbing on capacity that left, not on freight that returned.
North American Intermodal
2.3%
U.S. Intermodal
2.8%
Volume by Class 1 Railroad
| BNSF | 5% |
| CN | -1% |
| CPKC | -1.9% |
| CSX | 5.6% |
| GMXT | 15.1% |
| NS | 3.4% |
| UP | -3.1% |
Intermodal Spot Rate Trend Charts
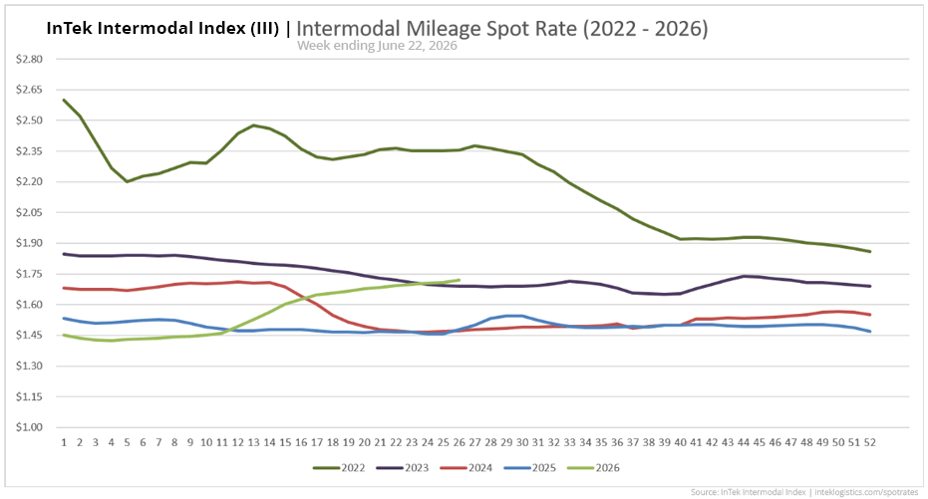
Intermodal Spot Rate Per Mile (Including Fuel)
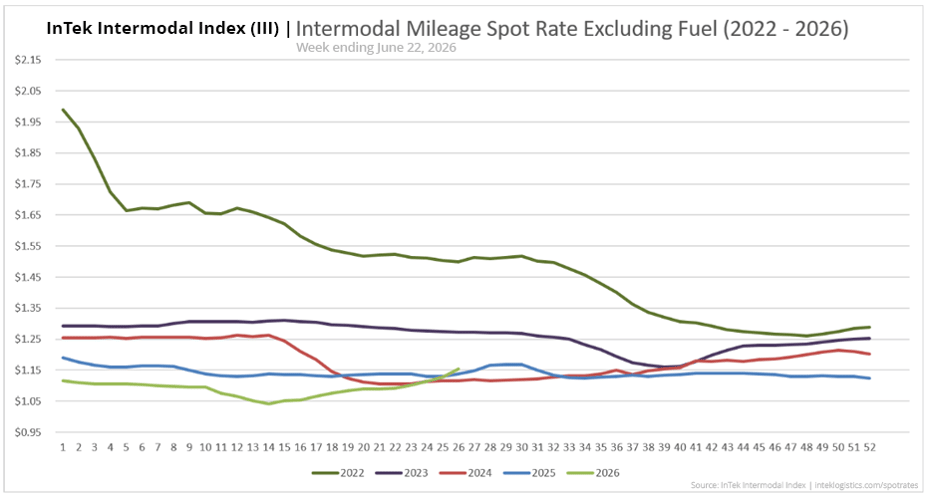
Intermodal Spot Rate Per Mile (Excluding Fuel)
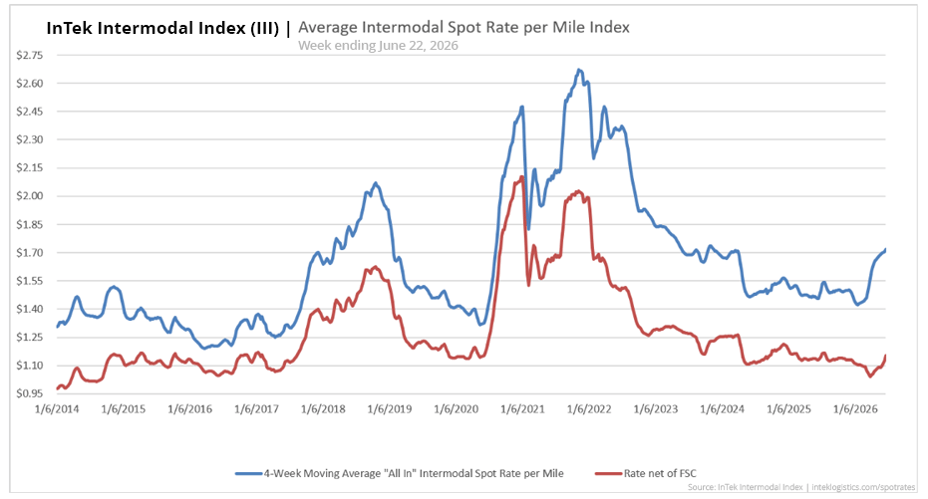
Intermodal Spot Rate Average Per Mile (2014-2026)
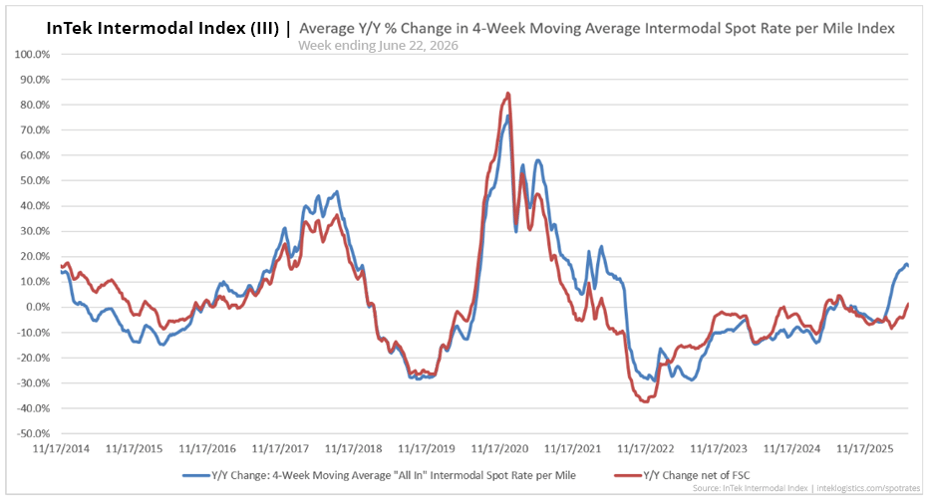
Intermodal Spot Rate Y/Y % Change (2014-2026)

What to watch next week
Three things to watch heading into the week of June 29, 2026.
Will the intermodal index hold above the year-ago line?
A single crossing is a milestone; a trend takes consecutive weeks above it.

Will diesel keep falling?
The latest EIA outlook has the third quarter path at roughly $4.94 - will it stabilize, keep dropping or reverse course?

Will truckload's weekly pullback reverse?
Truckload had been lockstep weekly with intermodal, but even with this week's dip - spot rates have been well ahead annually. Will the intermodal and truckload climb resume together?

Last week's scorecard
Last week we flagged three things. Here is how they played out.
-
Intermodal spot rate crosses positive year over year: Hit - The index moved from just under the line to 1.4% above it.
-
Diesel breaks below $5.00: Hit - It closed the week at $4.832.
-
Truckload holds its recent gains: Partial - Truckload slipped 4.4% on the week but held a 17.3% year-over-year lead.
About the InTek Intermodal Index:
The InTek Intermodal Index (III) tracks weekly domestic intermodal spot rates on a per-mile basis, both including and excluding fuel surcharges. Each week's report includes comprehensive market analysis covering truckload pricing trends, diesel fuel costs, and Class I railroad intermodal volumes to provide context for rate movements.
Published every Thursday since 2014, the Index serves as a resource for shippers, carriers, and industry analysts tracking North American freight market trends.
Citation: InTek Intermodal Index. (2026). Weekly Intermodal Spot Rate Report. Retrieved from https://www.inteklogistics.com/spot-rates
Want custom pricing for your lanes?
Get a tailored intermodal quote based on your specific shipping needs and freight profile.