
![]()
InTek Intermodal Index (III) Week Ending June 29, 2026

Weekly market intelligence including the InTek Intermodal Index (tracking intermodal spot rates), along with truckload pricing, diesel trends, and railroad volumes - Historical Edition
This Week at a Glance
Week ending June 29, 2026
Intermodal Spot Rate
(excluding fuel)
▲ +1.9% vs. last week
▲ +2.4% vs. last year

Truckload Spot Rate
(excluding fuel, DAT)
▲ +2.5% vs. last week
▲ +29.4% vs. last year

Diesel Fuel
(EIA National Average)
▼ -3.4% vs. last week
▲ +25.2% vs. last year

Intermodal Volume
(YTD vs. 2025)
U.S. ▲ +3.1%
North American ▲ +2.5%

This Week's Analysis
By Rick LaGore, CEO, InTek Logistics | June 29, 2026
Analysis of the InTek Intermodal Index (III) and freight market trends
Trends in the Intermodal Transportation Spot Rate and Market
Intermodal spot rates crossed above their year-ago level last week, and this week they held there. That makes two straight weeks with a positive year-over-year reading for the InTek Intermodal Index, after most of the current cycle spent below 2025 while truckload climbed.
A second week above the line matters more than the first, because it starts to separate a genuine turn from a one-week blip, and it changes how shippers should read the market heading into the second half.
Intermodal spot is up 2.4% year over year while truckload spot is up 29.4%. Both are rising, but truckload is rising much faster, which means the cost gap between the two modes is wide and the intermodal savings on qualifying lanes are large. That is the conversion window: truckload setting the ceiling, intermodal firming underneath it with room to spare.
Price and volume moving up together is the fuller version of the signal we watch, intermodal confirming the truckload direction rather than price alone. It is confirmation of direction, not evidence of a demand surge. The supply side did the heavy lifting, and the read stays measured until the volume trend extends.
InTek Intermodal Index (excluding fuel):
- Up 1.9% vs. prior week
- Up 2.4% vs. prior year
This is the second straight week the InTek Intermodal Index - which tracks domestic intermodal spot rates - has run above its year-ago level, and firming another 1.9% weekly.
Intermodal spot spent much of the downcycle beneath 2025, so a positive annual comparison holding for a second week, with the weekly rate still climbing, tells us the floor is behind us and the direction has changed.
The fact that it's a measured move, rather than a jump, is a key signifier of a firming intermodal market when it steadily follows truckload up.
National Truckload Spot Rate (DAT, excluding fuel): (DAT Trendline Report)
- Up 2.5% vs. prior week
- Up 29.4% vs. prior year
Truckload tells the same directional story with far more force. It has led this move for months on the supply side, capacity that exited under cost pressure and tighter driver enforcement, rather than a demand surge.
The last week of June added its own pressure. Month-end, quarter-end, and the run-up to the July 4 holiday compressed the shipping calendar and handed carriers even more leverage on rates.
Diesel Fuel (EIA):
- $4.67/gallon
- Down $0.164 (3.4%) vs. prior week
- Up $0.941 (25.2%) vs. prior year
Diesel continues to retrace from the June spike tied to Middle East conflict, but it remains well above 2025.
For shippers weighing modes, elevated diesel keeps intermodal's fuel-efficiency advantage in play, even as the weekly easing trims that edge at the margin.
(The full spreadsheet of the historical weekly price moves of diesel full can be found at https://www.eia.gov/petroleum/gasdiesel.)
Year-to-Date Intermodal Volume by Region and Railroad vs. 2025
Volume is confirming price. Both North American and U.S. intermodal volumes are running ahead of last year.
CSX, BNSF, and NS lead the domestic network, and cross-border volume through GMXT is up 15.4%, consistent with the Mexico freight trend. CN, CPKC, and UP sit modestly below last year's pace.
North American Intermodal
2.5%
U.S. Intermodal
3.1%
Volume by Class 1 Railroad
| BNSF | 5.1% |
| CN | -1.3% |
| CPKC | -1.9% |
| CSX | 5.8% |
| GMXT | 15.4% |
| NS | 3.8% |
| UP | -2.7% |
Intermodal Spot Rate Trend Charts
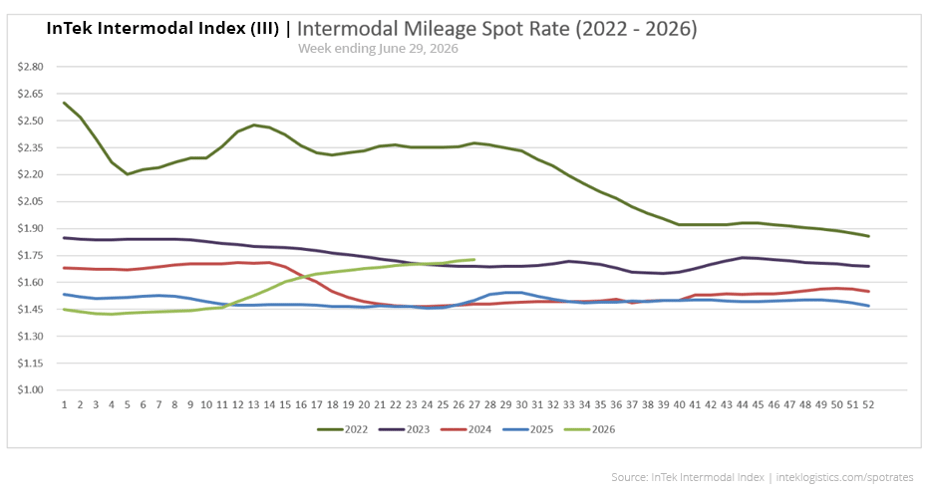
Intermodal Spot Rate Per Mile (Including Fuel)
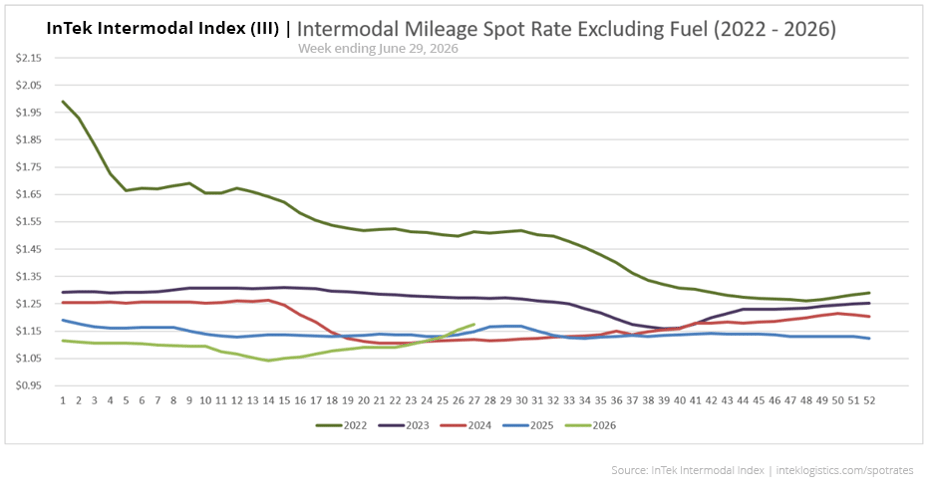
Intermodal Spot Rate Per Mile (Excluding Fuel)
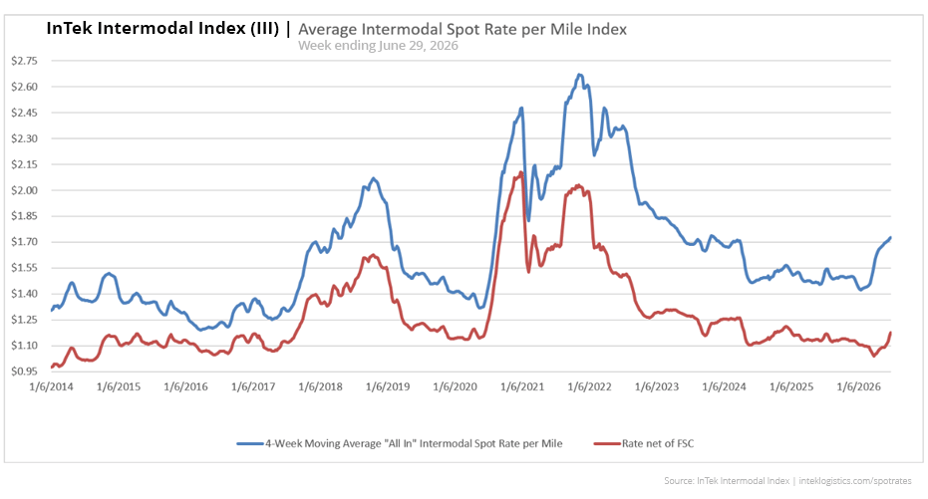
Intermodal Spot Rate Average Per Mile (2014-2026)
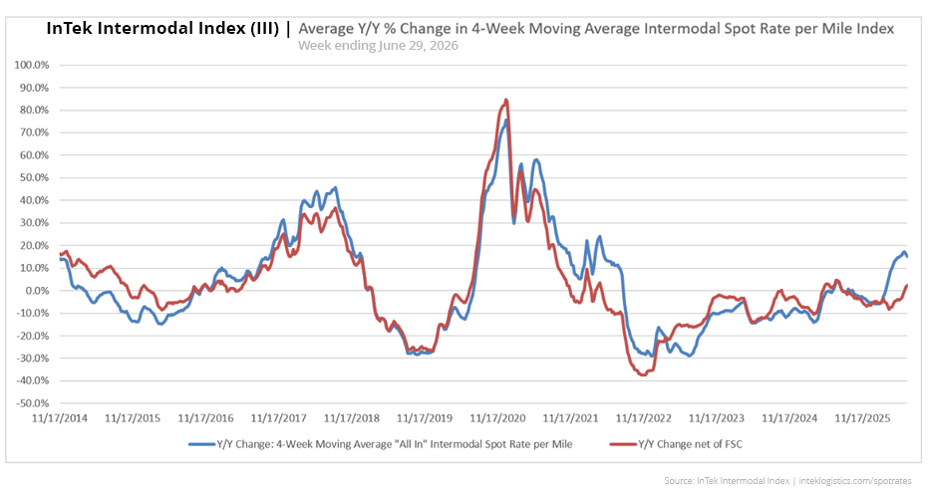
Intermodal Spot Rate Y/Y % Change (2014-2026)

What to watch next week
Three things to watch heading into the week of July 6, 2026.
Will intermodal spot holds a positive year-over-year reading for a third straight week?
If the growth keeps firming, it signals durability, which matters more than any single print.

How will the Independence Day week affect truckload?
Tender rejections and spot rates through the holiday week may be outliers. Month-end, quarter-end, and the July 4 slowdown can distort the read, so watch the trend into mid-July rather than the daily noise.

What will the next round of freight & economic data look like?
The June LMI, ISM and jobs figures - along with the later release of the Cass Freight Index - will help signal whether demand is joining the supply move.

Last week's scorecard
Last week we flagged three things. Here is how they played out.
-
Will the intermodal index hold above the year-ago line? Yes. Intermodal spot finished 2.4% above last year, a second straight week above the line. One crossing was the milestone; two in a row is the start of a trend.
-
Will diesel keep falling? It did. On-highway diesel dropped another 3.4% to $4.668, and it is now running below the roughly $4.94 the EIA had penciled in for the third quarter.
-
Will truckload's weekly pullback reverse? It reversed. Truckload spot rose 2.5% on the week after the prior week's dip, so both modes climbed together again, intermodal up 1.9% and truckload up 2.5%.
About the InTek Intermodal Index:
The InTek Intermodal Index (III) tracks weekly domestic intermodal spot rates on a per-mile basis, both including and excluding fuel surcharges. Each week's report includes comprehensive market analysis covering truckload pricing trends, diesel fuel costs, and Class I railroad intermodal volumes to provide context for rate movements.
Published every Thursday since 2014, the Index serves as a resource for shippers, carriers, and industry analysts tracking North American freight market trends.
Citation: InTek Intermodal Index. (2026). Weekly Intermodal Spot Rate Report. Retrieved from https://www.inteklogistics.com/spot-rates
Want custom pricing for your lanes?
Get a tailored intermodal quote based on your specific shipping needs and freight profile.