
![]()
InTek Intermodal Index (III) Week Ending Aug. 3, 2026

Weekly market intelligence including the InTek Intermodal Index (tracking intermodal spot rates), along with truckload pricing, diesel trends, and railroad volumes - Historical Edition
This Week at a Glance
Week ending August 3, 2026
Intermodal Spot Rate
(excluding fuel)
▼ -0.6% vs. last week
▲ +2.6% vs. last year

Truckload Spot Rate
(excluding fuel, DAT)
▼ -0.4% vs. last week
▲ +28.7% vs. last year

Diesel Fuel
(EIA National Average)
▲ +0.7% vs. last week
▲ +40.7% vs. last year

Intermodal Volume
(YTD vs. 2025)
U.S. ▲ +3.5%
North American ▲ +2.9%

This Week's Analysis
By Rick LaGore, CEO, InTek Logistics | August 3, 2026
Analysis of the InTek Intermodal Index (III) and freight market trends
Trends in the Intermodal Transportation Spot Rate and Market
Three series came in near-flat this week. Truckload spot eased 0.4%, intermodal spot was off 0.6%, and diesel added 0.7%. After a month in which truckload swung up 7.4%, down 5.0%, up 4.8%, and down 3.1%. The absence of movement is the week's actual news.
That settling answers the question the past few weeks left open. Truckload found a level instead of continuing lower, and the level sits above its pre-holiday base with the year-over-year premium unchanged at 28.7%. July's peak now reads as a peak rather than a step in a climb.
Last week's composition point holds and hardens. Fuel is still the largest single line separating the two modes on cost, and at 40.7% above last year it has become a level story instead of a momentum story. Diesel stopped climbing this week but importantly, did not come down.
For a shipper, a plateau is worth more than a swing. Levels are what bids get priced against, and this is the first week since June that the numbers on the table are steady enough to build a fourth-quarter plan on.
The demand read has not changed. Truckload is expensive because capacity left, and nothing in this week's data argues otherwise. What changed is that the market stopped moving long enough to be measured.
That matters more than it sounds. Every bid built in July was built on numbers moving 5% a week. This week's numbers are ones a plan can actually use: truckload roughly 29% above last year and holding, intermodal flat to slightly soft on a working-week basis, diesel above $5.30 and no longer climbing.
The planning consequence is to treat $5.30 diesel as an assumption instead of a spike to wait out. Three weeks of increases followed by a flat week is a new base. Fuel surcharge exposure on truckload contracts written a year ago against $3.80 diesel is now roughly a dollar and a half per gallon out of position, and the fuel-efficiency gap between rail and road does not move with the price.
One number has not confirmed any of this. Demand. US intermodal is holding share while total freight contracts, which is the share story continuing rather than a demand story starting. The next Cass shipments print remains the cleaner test.
InTek Intermodal Index (excluding fuel):
- Down 0.6% vs. prior week
- Up 2.6% vs. prior year
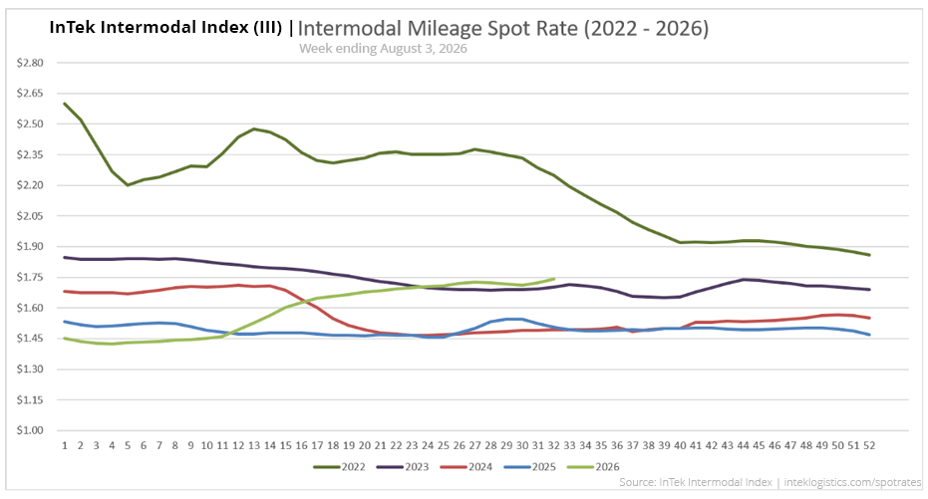
The InTek Intermodal Index (III), which tracks intermodal spot rates, eased 0.6%, a third consecutive week lower, while the year-over-year reading firmed again to 2.6% from 1.8%.
The split on week-over-week and year-over-year where the weekly numbers get weaker, yet the year-over-year improvemes has now run three straight weeks. A year-over-year line firming on top of a falling weekly line does not indicate price strength. Reading it as strength is how a shipper talks themselves into paying for a market that is not there.
What the pattern says is that capacity is available to the freight converting into intermodal. Volume is moving and price is not being bid up to get it, which is the signature of a mode absorbing share without tightening. In the end, the four-week trend still carries more information than any single print.
National Truckload Spot Rate (DAT, excluding fuel): (DAT Trendline Report)
- Down 0.4% vs. prior week
- Up 28.7% vs. prior year
Truckload spot eased 0.4%, and the five-week sequence now reads up 7.4%, down 5.0%, up 4.8%, down 3.1%, down 0.4%. Amplitude collapsed. What was oscillating around a level has become the level.
The year-over-year number held at 28.7% for a second week after four weeks at 29.4%. Two readings do not a trend make, but a premium that stopped falling one step below its high is a different picture than one working its way down.
Importantly for shippers: the repricing runway has not closed. A 28.7% increase in linehaul is still meaningful, and that gap between intermodal and truckload is what matters heading into fourth-quarter RFP work. In other words, truckload settling is not truckload getting cheap.
Diesel Fuel (EIA):
- $5.348/gallon
- Up $0.035 (0.7%) vs. prior week
- Up $1.548 (40.7%) vs. prior year
Diesel added 3.5 cents to $5.348, a fourth straight increase, and now sits 40.7% above last year. The move stalled without reversing. Against roughly 73 cents added over the prior three weeks, a 3.5-cent week is the run losing its legs.
It's worth separating the two readings, because they point in different directions. Weekly change says the pressure eased. The year-over-year gap widened again, to 40.7% from 39.6%, because last year's comparison week keeps stepping down. Both are true, which is why the level is the number to carry and not either change.
The driver has not changed. Crude stayed contained while diesel ran, because the tightness sits in refining and distillate supply rather than the barrel. A crude forecast is still different from a fuel surcharge forecast, and the two should not be modeled off one line.
(The full spreadsheet of the historical weekly price moves of diesel full can be found at https://www.eia.gov/petroleum/gasdiesel.)
Year-to-Date Intermodal Volume by Region and Railroad vs. 2025
Year-to-date volume held this week. U.S. intermodal stayed at 3.5% for a third consecutive week and North America ticked up a tenth to 2.9%.
Underneath the flat top line, the western and Canadian carriers moved in opposite directions. UP improved to -1.2% from -1.4% and CPKC improved to -1.0% from -1.4%, both narrowing their deficits for a second week.
CN slipped again to -2.5% and remains the softest reading in the group. Among the eastern carriers, NS added a tenth to 4.3% while CSX eased to 5.8%. BNSF eased to 5.1%. GMXT sits at 18.8%, though it runs off a smaller base than the US carriers and swings further on any given week, so it should be weighted accordingly.
North American Intermodal
2.9%
U.S. Intermodal
3.5%
Volume by Class 1 Railroad
| BNSF | 5.1% |
| CN | -2.5% |
| CPKC | -1% |
| CSX | 5.8% |
| GMXT | 18.8% |
| NS | 4.3% |
| UP | -1.2% |
Intermodal Spot Rate Trend Charts
Intermodal Spot Rate Per Mile (Including Fuel)
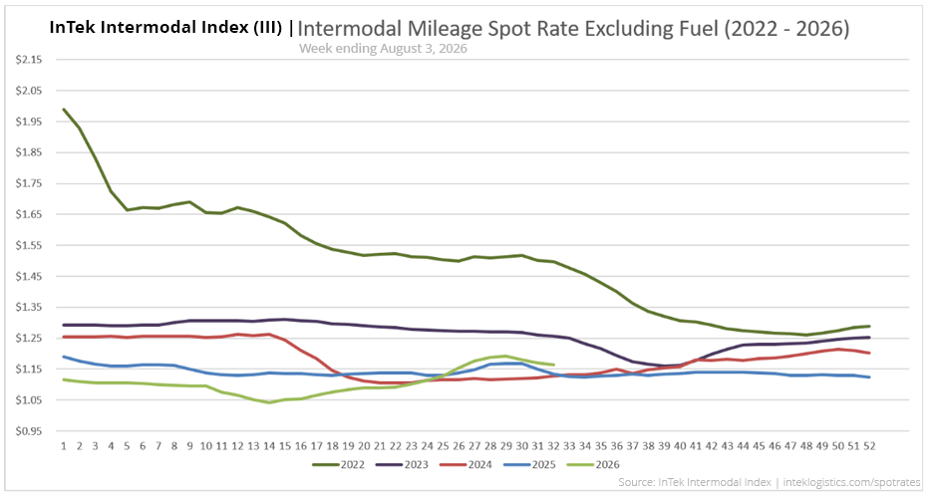
Intermodal Spot Rate Per Mile (Excluding Fuel)
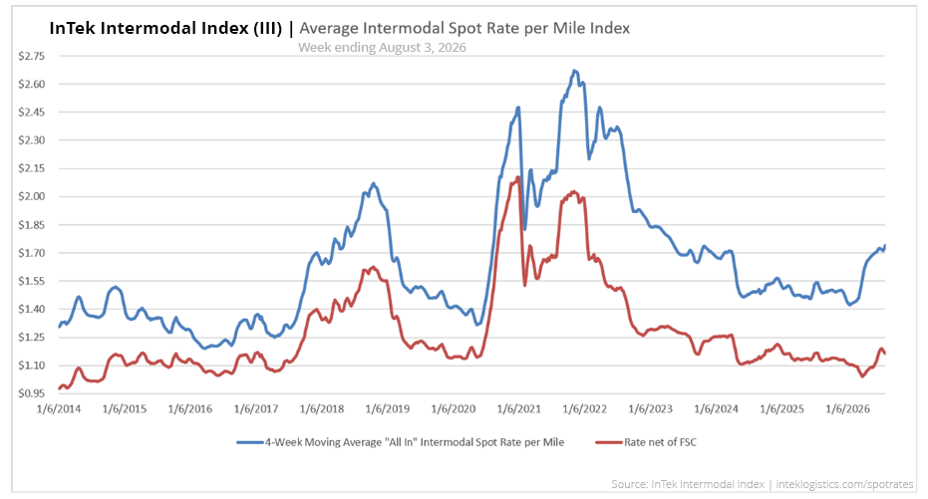
Intermodal Spot Rate Average Per Mile (2014-2026)
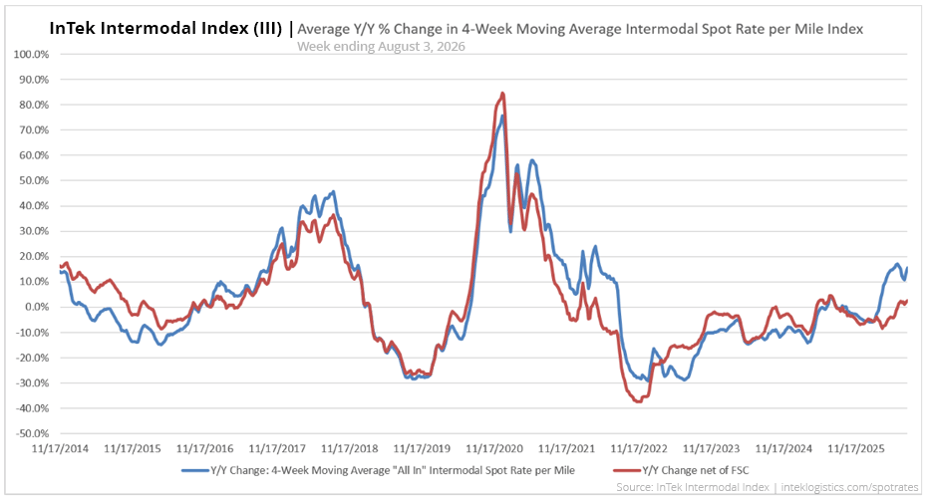
Intermodal Spot Rate Y/Y % Change (2014-2026)

What to watch next week
Three things to watch heading into the week of August 3, 2026.
Does truckload hold this level or head lower?
One flat week is not a floor any more than one 7.4% jump was a trend. Watch whether the spot price stays parked above its pre-holiday base or starts working down again, and watch the year-over-year premium specifically. Two weeks at 28.7% is a pause, but a third makes it a level.

Is the diesel run over or only paused?
A 3.5-cent week after three weeks averaging 24 cents is a real change in pace. Watch the August 10 EIA print to see whether refining tightness is resolving or simply catching its breath. A second flat week makes $5.30 the fourth-quarter planning assumption instead of a question.

Does contract data close the repricing question?
The gap between a 28.7% spot premium and mid-single-digit contract linehaul has stayed open for weeks. Cass linehaul and the next round of contract reads are the only things that answer it. Until they land, the runway assumption stands on spot data alone, which is thinner ground than it should be.

Last week's scorecard
Last week we flagged three things. Here is how they played out.
-
Does truckload spot confirm a peak? Yes. Spot eased only 0.4% and settled above its pre-holiday base instead of continuing lower, and the year-over-year premium held at 28.7% rather than stepping down a second time. July's high reads as the peak of the run.
-
Does diesel roll over or keep climbing? Neither, which was the outcome not on the list. Diesel posted a fourth straight increase, but at 3.5 cents against a three-week average near 24 cents. The climb stalled without reversing. Refining tightness has not resolved, nor has it worsened.
-
Does intermodal volume hold its share lead? Yes. US intermodal held 3.5% year to date for a third week and North American added a tenth to 2.9%. Share is holding against a contracting freight market, which is the reading that was worth watching.
About the InTek Intermodal Index:
The InTek Intermodal Index (III) tracks weekly domestic intermodal spot rates on a per-mile basis, both including and excluding fuel surcharges. Each week's report includes comprehensive market analysis covering truckload pricing trends, diesel fuel costs, and Class I railroad intermodal volumes to provide context for rate movements.
Published every Thursday since 2014, the Index serves as a resource for shippers, carriers, and industry analysts tracking North American freight market trends.
Citation: InTek Intermodal Index. (2026). Weekly Intermodal Spot Rate Report. Retrieved from https://www.inteklogistics.com/spot-rates
Want custom pricing for your lanes?
Get a tailored intermodal quote based on your specific shipping needs and freight profile.