
<img alt="" src="https://secure.perk0mean.com/182585.png" style="display:none;">

red-accent


InTek Intermodal Index (III) Week Ending Nov. 2, 2026

InTek Intermodal Index (III) Logo


Weekly market intelligence including the InTek Intermodal Index (tracking intermodal spot rates), along with truckload pricing, diesel trends, and railroad volumes - Historical Edition


→ Back to the archive

→ View the current edition

Get an intermodal quote

About-Hero-curve-1

This Week at a Glance

Week ending November 2, 2026

Train Truck Background Sketch-Light-Even

This Week's Analysis

By Rick LaGore, CEO, InTek Logistics | November 3, 2026

Analysis of the InTek Intermodal Index (III) and freight market trends

Trends in the Intermodal Transportation Spot Rate and Market

To sum up the week, the modes moved in opposite directions. Intermodal spot gave back a little after its climb through the quarter, while truckload posted a solid 2.3% gain, so the linehaul spread widened in intermodal's favor.

Diesel took a breather after a run of gains, and the volume data took a one-week hit from flooding in the Southwest without breaking the trend.

The indexes split this week, with truckload up 2.3% and intermodal down 0.3%, so the linehaul spread widened. Intermodal's cost base sits 7.6% above last year against truckload's 46.6% step up, both excluding fuel.

Price the spread on total cost with fuel included. Diesel at 67.7% above last year keeps fuel the biggest single item in the comparison. It eased this week, so watch the 3-2-1 crack spread for whether that is a pause or the start of a pullback.

InTek Intermodal Index (excluding fuel):

  • Down 0.3% vs. prior week
  • Up 7.6% vs. prior year

The InTek Intermodal Index (III), which tracks intermodal spot rates,dipped 0.3% for the week and holds 7.6% above last year. Coming off last week's near-flat print, that is the first step back after a steady run through the quarter, and it reads as a plateau at a firm level instead of a full-fledged turn.

The year-over-year figure eased a few tenths but stays well above where it started the fall. It is the number that tracks how far intermodal's cost base has moved off last year. Drayage stays tight across much of the network, and as we continue to stress: that first and last leg is where a shipper most feels service, not in the rail move between ramps.

National Truckload Spot Rate (DAT, excluding fuel): (DAT Trendline Report)

  • Up 2.3% vs. prior week
  • Up 46.6% vs. prior year

Truckload spot rose 2.3% for the week and holds 46.6% above last year. That is a meaningful weekly move, and it comes as posted truck capacity runs about a quarter below last year while load posts run well above it. With truckload up and intermodal down, the linehaul spread widened this week on lanes where both compete.

Gas Pump Sketch Light

Diesel Fuel (EIA):

  • $6.292/gallon
  • Down $0.06 (0.9%) vs. prior week
  • Up $2.539 (67.7%) vs. prior year

Diesel fell 6 cents to $6.292 per gallon, down 0.9% on the week and up $2.539 (67.7%) on the year. This is the first weekly decline after a run of gains, and EIA shows every region lower. One soft week does not undo the climb, but the year-over-year gap has slipped back below 70%.

The driver has not changed, which is in refining and distillate supply instead of straight crude, so the direction tracks refining margins more than the oil price. For a shipper, the 3-2-1 crack spread is what to watch for where diesel goes next. Rail is roughly three times more fuel efficient than over-the-road truck on a ton-mile basis. At a 67.7% year-over-year gap, fuel keeps pulling marginal long-haul freight to rail.

(The full spreadsheet of the historical weekly price moves of diesel full can be found at https://www.eia.gov/petroleum/gasdiesel.)


Year-to-Date Intermodal Volume by Region and Railroad vs. 2025

North American intermodal volume is 3.7% ahead of 2025 year-to-date and U.S. volume 4.5%, both unchanged from last week. The latest week was soft, with U.S. growth dropping to 3.9% from 11.3%, but the trend barely moved. The U.S. four-week rate eased to 9.7% from 10.5% and the steadier 13-week rate to 6.8% from 6.9%. A one-week drop that leaves the 13-week rate intact looks like a disruption rather than a demand turn, and the 13-week read stays the better guide as year-ago comparisons run soft into December.

The dip in volume and service is linked to flooding near Laguna, New Mexico - which closed both main tracks of a Southwest transcontinental route on October 24. The second track did not return until October 27, at reduced speeds. The Western US networks fell 8.1% on the week, though they still run 12.1% on a four-week basis. Without the flood, U.S. growth would have been closer to 8%. The East is the one soft spot the flood does not explain, down 7.2% on the week with no comparable event.

North American Intermodal

3.7%

U.S. Intermodal

4.5%

Volume by Railroad

BNSF 5.2%
CN -2.5%
CPKC 2.1%
CSX 5%
GMXT 11.8%
NS 4.4%
UP 3.4%


Dark-blue-curve-up

Intermodal Spot Rate Trend Charts

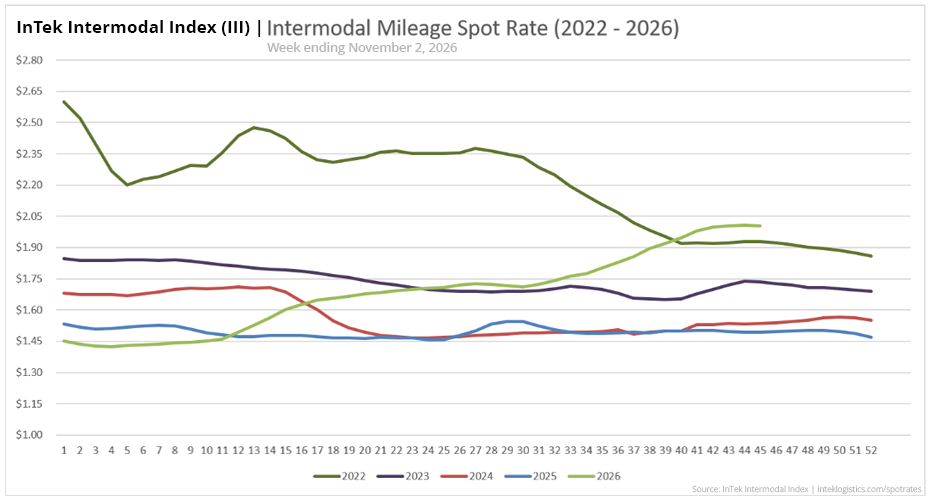
InTek Intermodal Index (III) spot rate per mile including fuel, showing weekly trends

Intermodal Spot Rate Per Mile (Including Fuel)
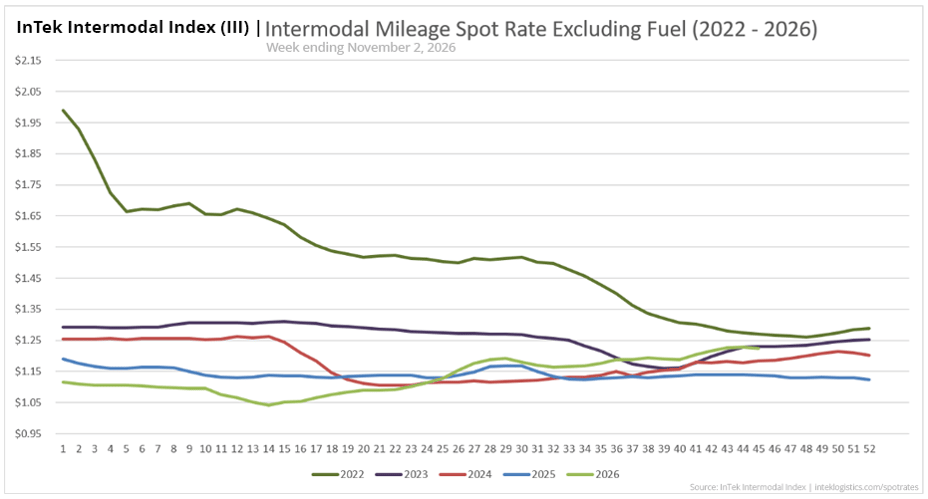
  

InTek Intermodal Index (III) spot rate per mile excluding fuel, showing weekly trends

Intermodal Spot Rate Per Mile (Excluding Fuel)
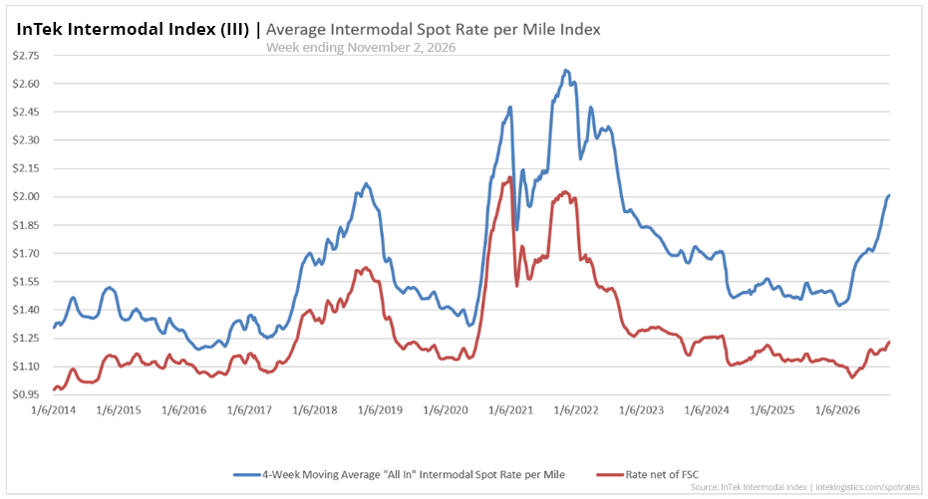
 

InTek Intermodal Index (III) average intermodal spot rate per mile from 2021 to 2026 Intermodal Spot Rate Average Per Mile (2014-2026)
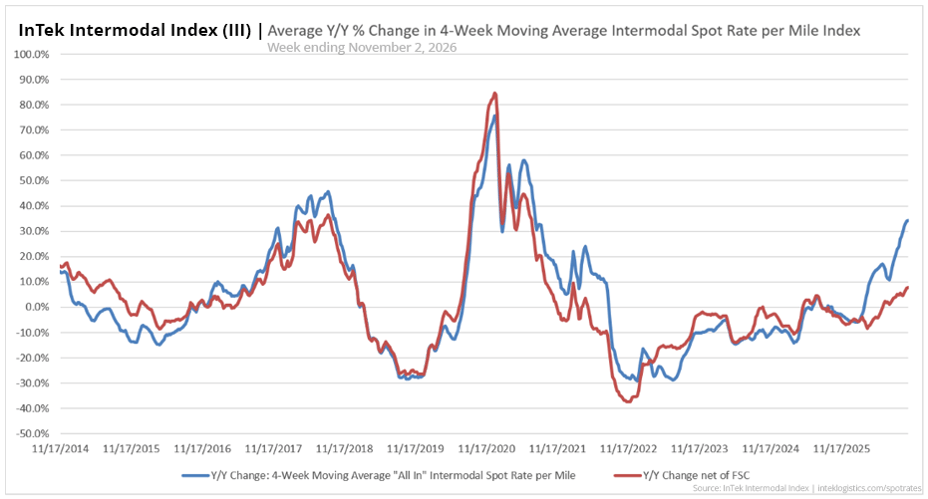
InTek Intermodal Index (III) average intermodal percentage rate change per mile from 2021 to 2026

Intermodal Spot Rate Y/Y % Change (2014-2026)

medium-blue-curve-down-right

What to watch next week

Three things to watch heading into the week of November 9, 2026.

Last week's scorecard

Last week we flagged three things. Here is how they played out.

  • Does intermodal spot resume or has it stalled? Stalled for now. Spot slipped 0.3% after last week's near-flat print, the first step back since the climb through the quarter. It reads as a plateau at a firm level, with the year-over-year gain still at 7.6%.

  • Does diesel keep climbing? No. Diesel fell 6.0 cents to $6.292, its first weekly decline after a run of gains, with every EIA region lower. The year-over-year gap slipped back to 67.7%.

  • Does domestic conversion hold as imports roll off? It held through a disruption. Year-to-date volume stayed at 3.7% in North America and 4.5% in the US, and the 13-week US rate barely moved at 6.8%. The weekly drop traced mostly to the Southwest flood, while the East's softer week is the early sign to watch as imports crest.

About the InTek Intermodal Index:

The InTek Intermodal Index (III) tracks weekly domestic intermodal spot rates on a per-mile basis, both including and excluding fuel surcharges. Each week's report includes comprehensive market analysis covering truckload pricing trends, diesel fuel costs, and railroad intermodal volumes to provide context for rate movements.

With rates tracked weekly since 2008, the Index serves as a resource for shippers, carriers, and industry analysts tracking North American freight market trends.

Citation: InTek Intermodal Index. (2026). Weekly Intermodal Spot Rate Report. Retrieved from https://www.inteklogistics.com/spot-rates

Divider


Want custom pricing for your lanes?

Get a tailored intermodal quote based on your specific shipping needs and freight profile.