
![]()
InTek Intermodal Index (III) Week Ending Nov. 9, 2026

Weekly market intelligence including the InTek Intermodal Index (tracking intermodal spot rates), along with truckload pricing, diesel trends, and railroad volumes - Historical Edition
This Week at a Glance
Week ending November 9, 2026
Intermodal Spot Rate
(excluding fuel)
▲ +0.3% vs. last week
▲ +8.1% vs. last year

Truckload Spot Rate
(excluding fuel, DAT)
▲ +1.6% vs. last week
▲ +46.2% vs. last year

Diesel Fuel
(EIA National Average)
▼ -2.6% vs. last week
▲ +58.4% vs. last year

Intermodal Volume
(YTD vs. 2025)
U.S. ▲ +4.7%
North American ▲ +3.8%

This Week's Analysis
By Rick LaGore, CEO, InTek Logistics | November 9, 2026
Analysis of the InTek Intermodal Index (III) and freight market trends
Trends in the Intermodal Transportation Spot Rate and Market
To sum up the week, both spot indexes moved up and diesel moved down. Intermodal spot recovered last week's dip with a 0.3% gain, while truckload added another 1.6%, so the linehaul spread widened again in intermodal's favor.
Diesel fell for a second straight week, and volume bounced back as Western rail capacity returned after the flood.
InTek Intermodal Index (excluding fuel):
- Up 0.3% vs. prior week
- Up 8.1% vs. prior year
The InTek Intermodal Index (III), which tracks intermodal spot rates, climbed 0.3% for the week and rose to 8.1% above last year. That erases last week's dip and confirms it as a pause, not a turn, with the index back near its high for the quarter. The year-over-year figure climbed half a point and is now above 8%.
Drayage stays tight across much of the network, and that first and last leg is where a shipper feels service, not in the rail move between the ramps.
National Truckload Spot Rate (DAT, excluding fuel): (DAT Trendline Report)
- Up 1.6% vs. prior week
- Up 46.2% vs. prior year
Truckload spot rose 1.6% for the week and holds 46.2% above last year. That is a second solid weekly gain, and it comes as dry van truck posts run 26.1% below last year while load posts run 26.8% above, with the load-to-truck ratio near 11 against about 6 a year ago. With truckload gaining faster than intermodal, the linehaul spread widened again on lanes where both compete.
Diesel Fuel (EIA):
- $6.127/gallon
- Down $0.165 (2.6%) vs. prior week
- Up $2.259 (58.4%) vs. prior year
Diesel fell 16.5 cents to $6.127 per gallon, down 2.6% on the week and up $2.259 (58.4%) on the year. This is the second straight weekly decline and the larger of the two. The year-over-year gap has dropped below 60%, and EIA's latest outlook still has diesel easing only gradually, with its 2027 forecast raised to $5.03 per gallon.
The driver has not changed, which is in refining and distillate supply, not in crude, so the direction tracks refining margins more than the oil price. For a shipper, the 3-2-1 crack spread, not the crude price, is what to watch for where diesel goes next. Rail is roughly three times more fuel efficient than over-the-road truck on a ton-mile basis. At a 58.4% year-over-year gap, fuel keeps pulling marginal long-haul freight to rail.
(The full spreadsheet of the historical weekly price moves of diesel full can be found at https://www.eia.gov/petroleum/gasdiesel.)
Year-to-Date Intermodal Volume by Region and Railroad vs. 2025
North American intermodal volume is 3.8% ahead of 2025 year-to-date and US volume 4.7%, both up from last week. The latest week rebounded, with US originations up 6.5% on the week and 11.0% on the year, from 3.9% last week. The US four-week rate rose to 9.9% from 9.7% and the steadier 13-week rate to 7.3% from 6.8%, which confirms last week's drop as a disruption. The 13-week read stays the better guide, since weak year-ago weeks from mid-November into December will overstate the four-week numbers.
Both US regions recovered. The Western networks rose 7.1% on the week, returning to 11.9% year over year in line with their four-week pace, and supplied about two-thirds of the US gain. The Eastern networks rose 5.4% and jumped to 9.6% year over year, so last week's Eastern dip was timing, helped by record October imports that shifted share toward East and Gulf ports. The constraint in the West is now rail capacity, with about 45,000 import containers waiting for trains at Los Angeles and Long Beach.
North American Intermodal
3.8%
U.S. Intermodal
4.7%
Volume by Railroad
| BNSF | 5.2% |
| CN | -2.4% |
| CPKC | 2.2% |
| CSX | 5.1% |
| GMXT | 11.8% |
| NS | 4.5% |
| UP | 3.7% |
Intermodal Spot Rate Trend Charts
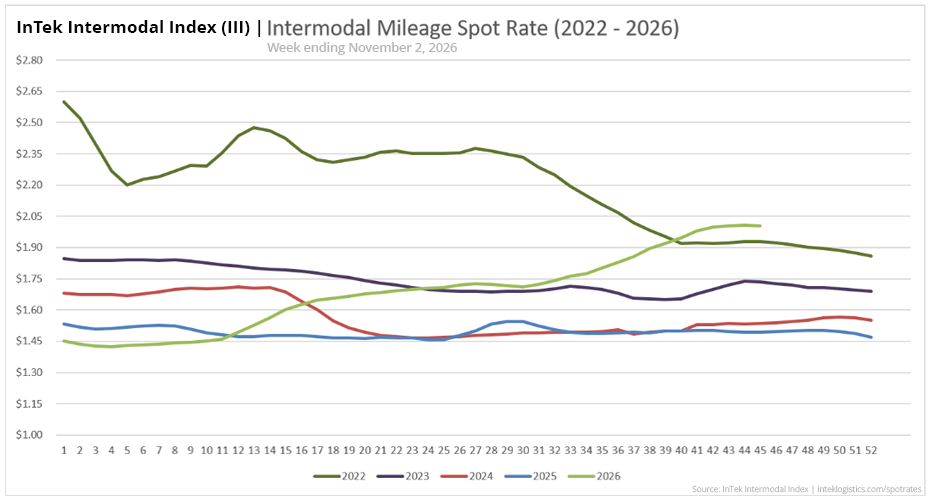
Intermodal Spot Rate Per Mile (Including Fuel)
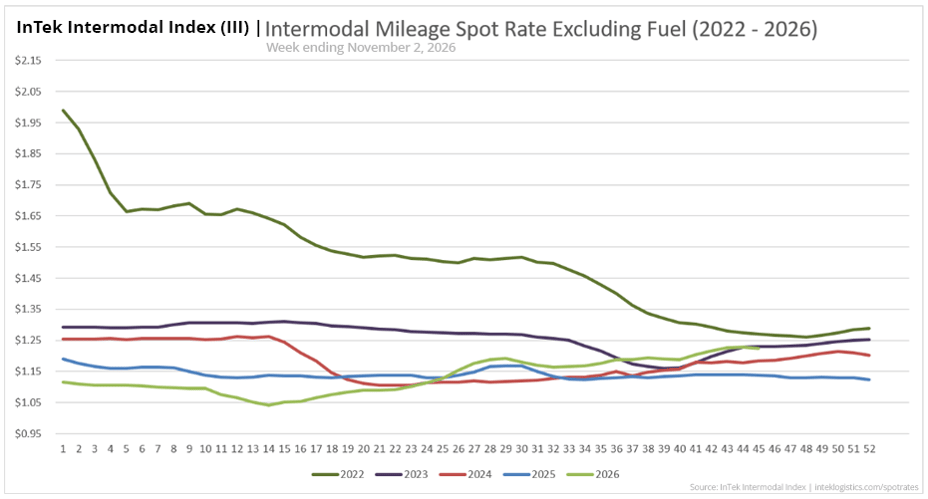
Intermodal Spot Rate Per Mile (Excluding Fuel)
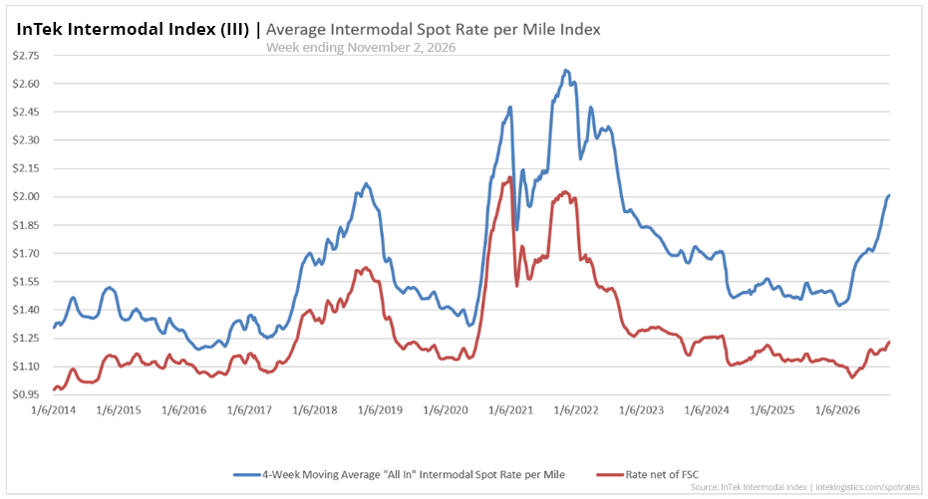
Intermodal Spot Rate Average Per Mile (2014-2026)
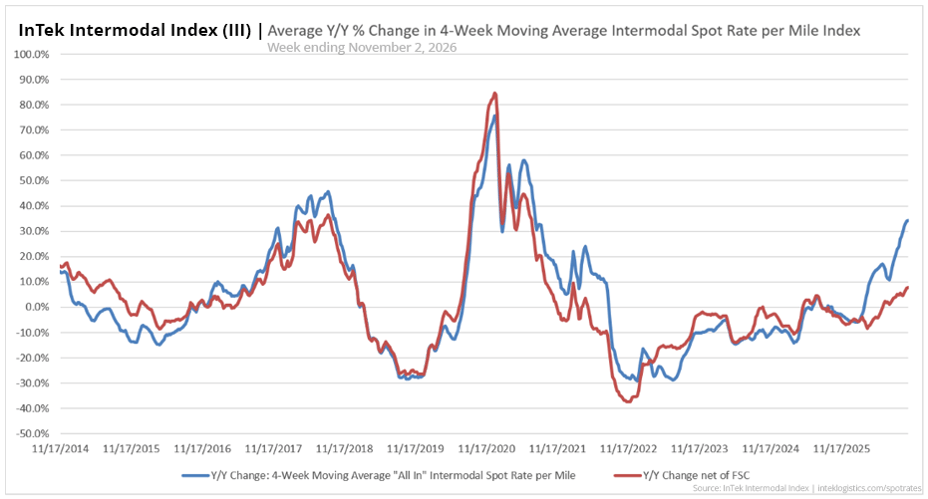
Intermodal Spot Rate Y/Y % Change (2014-2026)

What to watch next week
Three things to watch heading into the week of November 16, 2026.
Does intermodal spot follow truckload higher?
Spot recovered 0.3% as truckload added 1.6%, its second strong week. With the spread widening and Western rail capacity tight, watch whether intermodal pricing firms further or holds near its high as peak season matures.

Does diesel fall for a third week?
Diesel has dropped two straight weeks to $6.127. Watch the November 17 EIA print for whether the pullback continues. Even below 60% above last year, fuel keeps the intermodal advantage wide.

Does the Southern California rail queue shrink?
About 45,000 import containers are waiting for trains at Los Angeles and Long Beach. A shrinking queue with steady Western volume would show rail capacity catching up, while a growing one would push more freight to transload. In the East, watch whether volume holds near its current pace as November imports slow, and watch the November 20 port labor deadline at Long Beach and Los Angeles.

Last week's scorecard
Last week we flagged three things. Here is how they played out.
-
Is the intermodal dip a blip or a plateau? Spot rose 0.3% and erased last week's decline, and the year-over-year gain climbed to 8.1%.
-
Does diesel keep easing? Yes. Diesel fell 16.5 cents to $6.127, a larger drop than the week before, and the year-over-year gap narrowed to 58.4%.
-
Does the West bounce back, and is the East softening? The West bounced back, up 7.1% on the week, and the East was not softening, up 5.4% and 9.6% year over year. Year-to-date volume rose to 3.8% in North America and 4.7% in the US, and the US 13-week rate climbed to 7.3%
About the InTek Intermodal Index:
The InTek Intermodal Index (III) tracks weekly domestic intermodal spot rates on a per-mile basis, both including and excluding fuel surcharges. Each week's report includes comprehensive market analysis covering truckload pricing trends, diesel fuel costs, and railroad intermodal volumes to provide context for rate movements.
With rates tracked weekly since 2008, the Index serves as a resource for shippers, carriers, and industry analysts tracking North American freight market trends.
Citation: InTek Intermodal Index. (2026). Weekly Intermodal Spot Rate Report. Retrieved from https://www.inteklogistics.com/spot-rates
Want custom pricing for your lanes?
Get a tailored intermodal quote based on your specific shipping needs and freight profile.